Let's break down some specific data for the month of July for the top five "downtown" area's - specifically Centretown (including Golden Triangle), Byward Market and Sandyhill, Little Italy (which would include Lebreton Flats), Hintonburg, and Westboro. The information will be specific to apartment style condominiums, and only what sold through the MLS. Also, DOM (Day's On Market) is calculated to include the conditional period which in Ottawa is almost every single transaction to be roughly 10-14 days.
Centretown
The market in Centretown continued to tighten for July which is noticeable in the higher list to sold price ratio of 99.1% compared to 98.8% (from last month) and the fewer days on market of 43 compared to 46 (from last month). We still have a similar amount of new listings as last month, however the amount of units that sold have dropped from 43 (June) to 29 (July). Prices are up compared to last year, however holding about the same as last month.
What does this mean? While things have tightened up, the numbers would show that there is going to be more units available going into August. This might ease up the DOM, Sold Price Ratio, or the average sold price - more supply with equal or less demand.... Could be seeing a shift to a more buyer focused market.
Byward Market and Sandy Hill
(Includes Lowertown)
Compared to last month we have seen similar numbers except for two. The average price has jumped from $362,773 in June 2018, to $410,517 for July 2018. Keep in mind that in May 2018 it was almost $400k, so the large change is expected and due to the few number of data points that are used can vary the number. At the same time, the days on market has increased from 50 last month, to 84 this month. Note - the DOM hit 162 days back in January of 2016.
What does this mean? With the DOM jumping up to 84 days, yet amount of new and sold listings staying almost the same as last month, we would expect the price to come back down or the list to sold price ratio to drop. Still continues to be more of a buyers market, especially with the higher DOM, lower LTS price ratio, etc.
Little Italy
(Including Lebreton Flats)
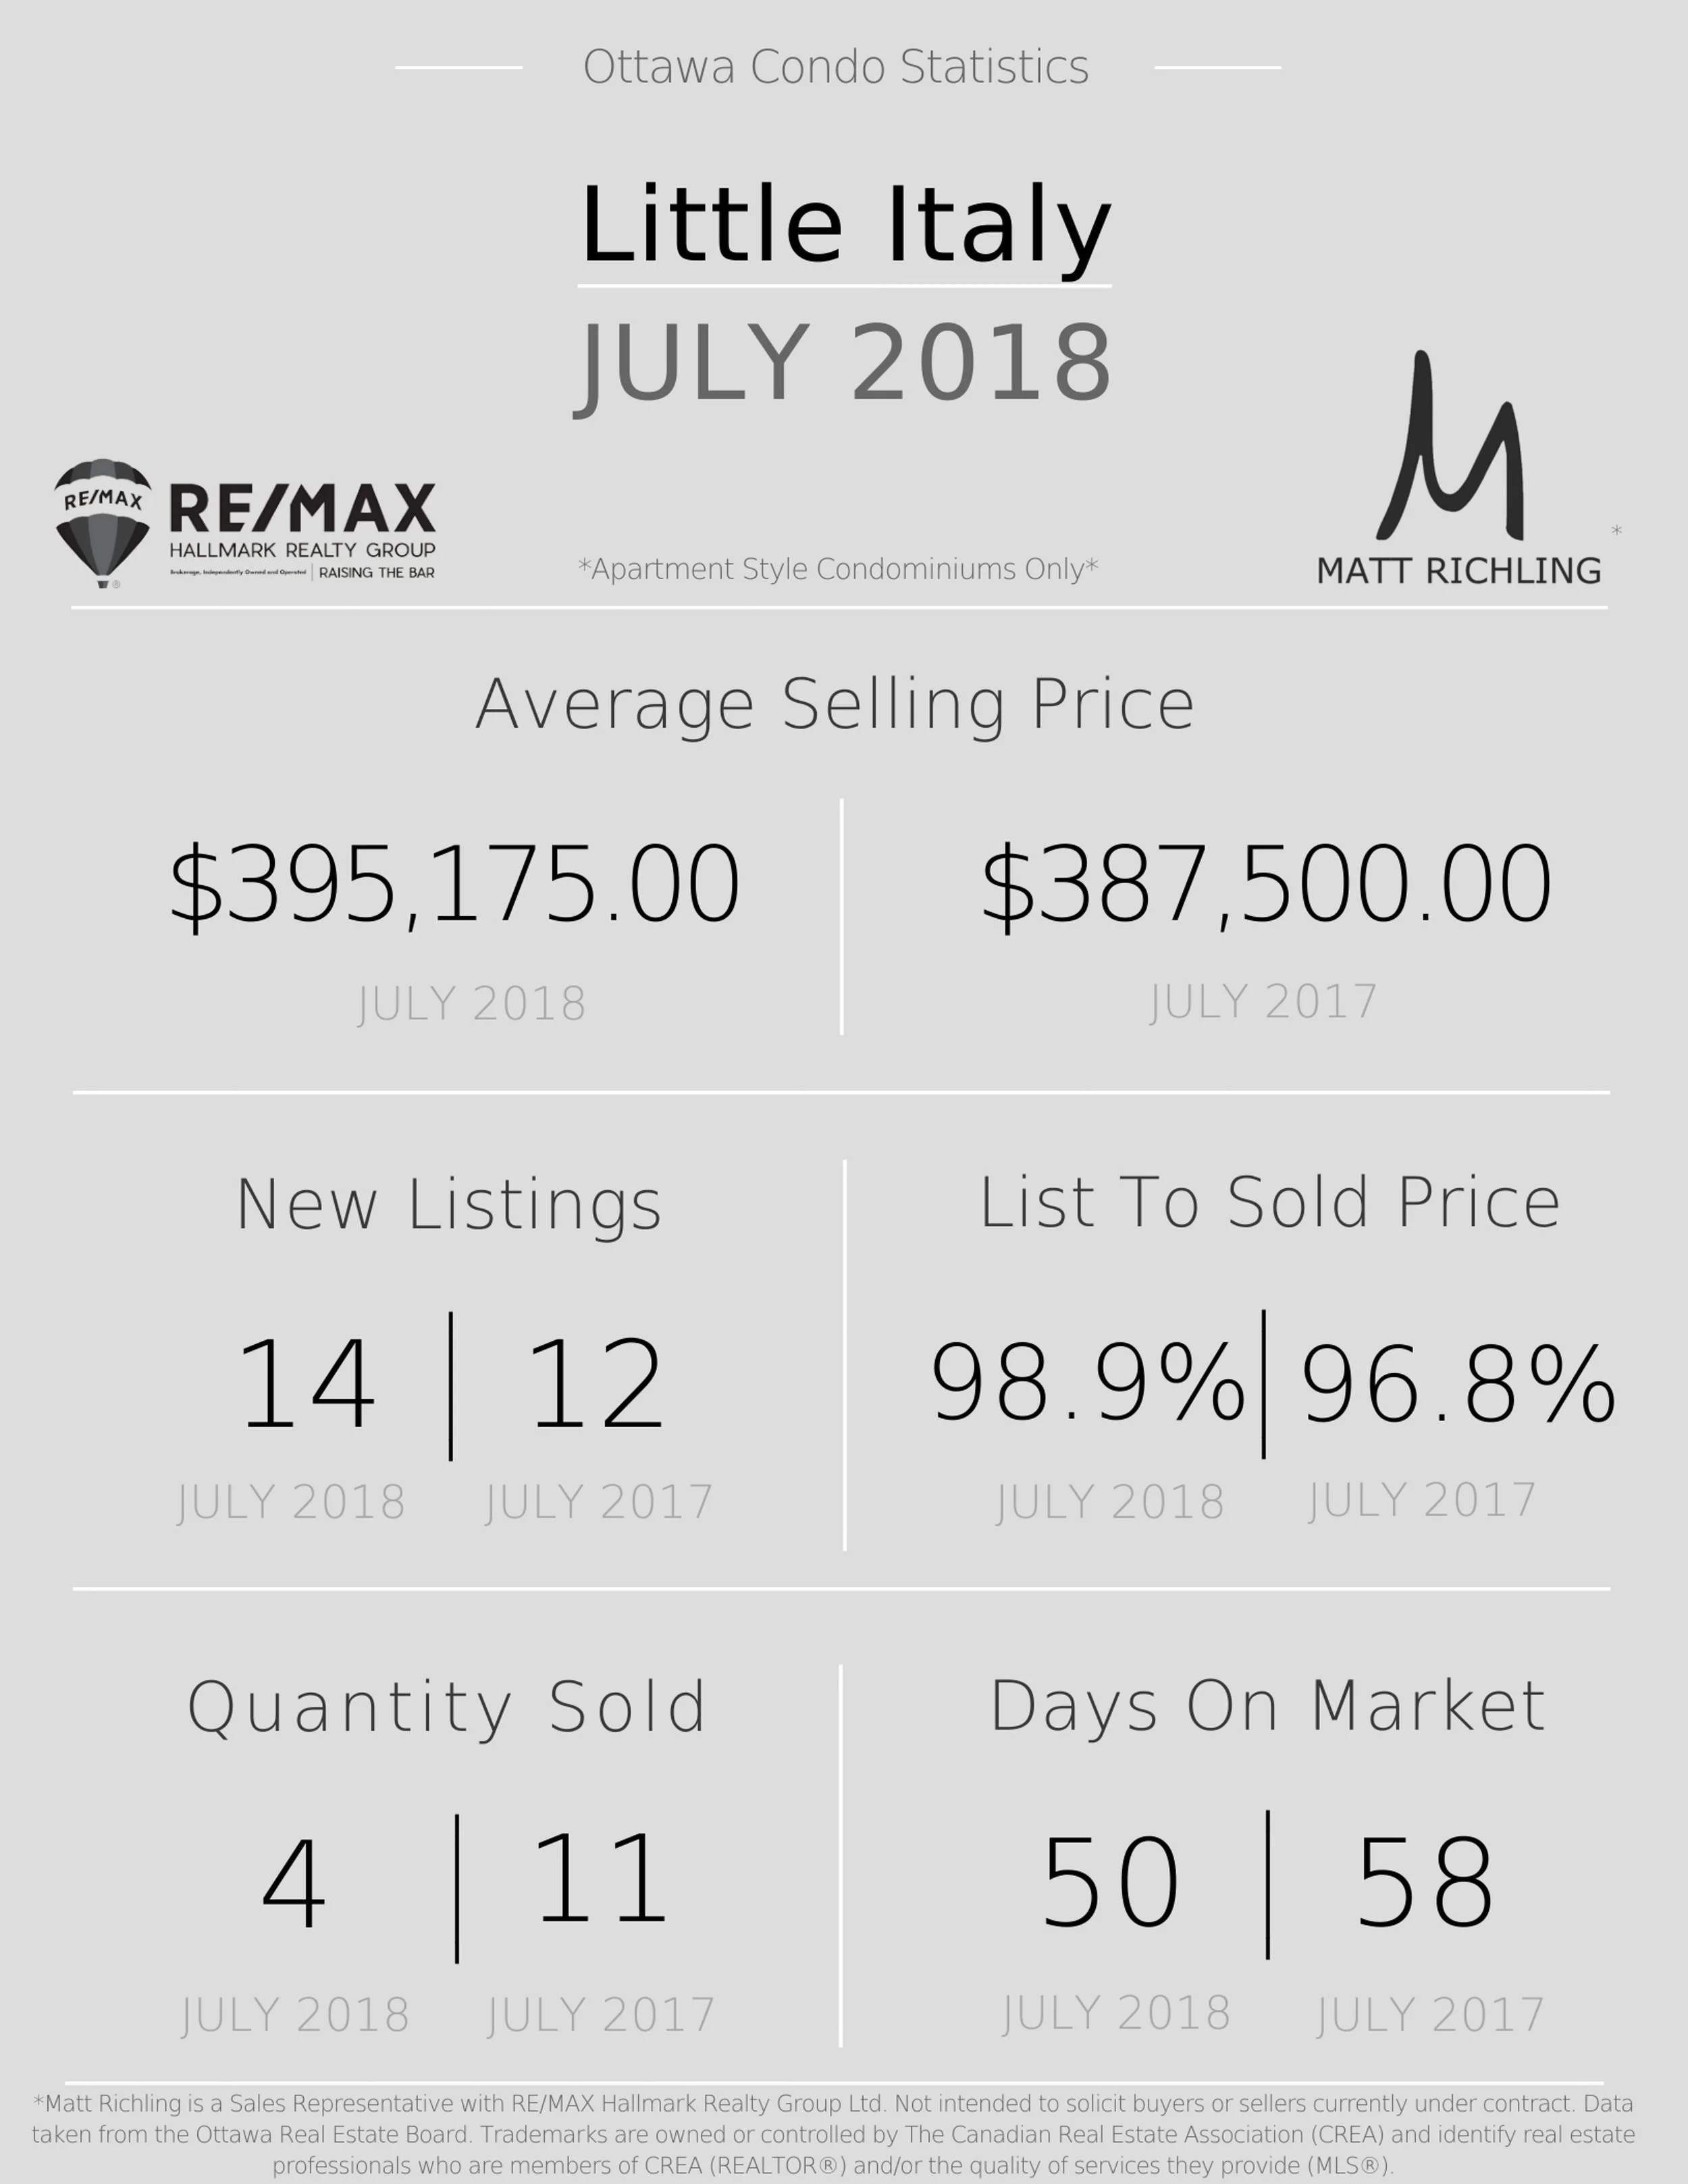
Average price has jumped over last month (June 2018) to $395,175. However that is based on the only four sales that happened this month. We continue to see more new listings, and fewer sales. DOM has increased to 50 days and the LTSP ratio has nudged up to almost 98.9%.
What does this mean? A buyers market. Higher DOM, more options (listings), etc. With only four sold it means you have less competition. However the high LTSP ratio says that for the sellers who are serious, and priced right, you can and will sell.
Hintonburg
The average sold price has dropped to $318,173, when it was $374,620 last month (June 2018). Activity has dropped (both new and sold listings), and the LTSP ratio edged up slightly.
What does this mean? More of a sellers market. With fewer units available overall, a higher sold price ratio, and a somewhat low DOM, It would be a good time to sell. Buyers will want to see more supply, or need to be quick on their feet for the best units.
Westboro
The average price is up over last month, but down over this time last year. Less activity then last month, but similar ratio of new vs sold units. Same LTSP ratio as last month with DOM increasing slightly.
What does this mean? Sellers market. Highest average price, and highest LTSP ratio, along with the similar ratio of new vs sold listings, make it a very difficult buyers market. Not much negotiating is going on. Chances of multiple offers are strong. Again, the higher price point is due mainly to the larger, longer planned living (compared to the studio and sub 600sqft units in Centretown etc.).
Looking for specific information about a building or area? Thinking of selling and want to get the best return? Let's chat. Fill out the form below.


