Building Update

Ottawa Condo Market Statistics - August 2022

Every month we take a closer look and drill down the sales data of Ottawa condos from the previous month. Here are the statistics for August 2022 in the top five "downtown" areas - Centretown, Byward Market and Sandy Hill, Little Italy (which includes Lebreton Flats), Hintonburg, and Westboro. The information will be specific to apartment-style condominiums, and only what sold through the MLS. Also important to note that DOM (Day's On Market) is calculated to include the conditional period, which in Ottawa is roughly 14 days for almost every single transaction.


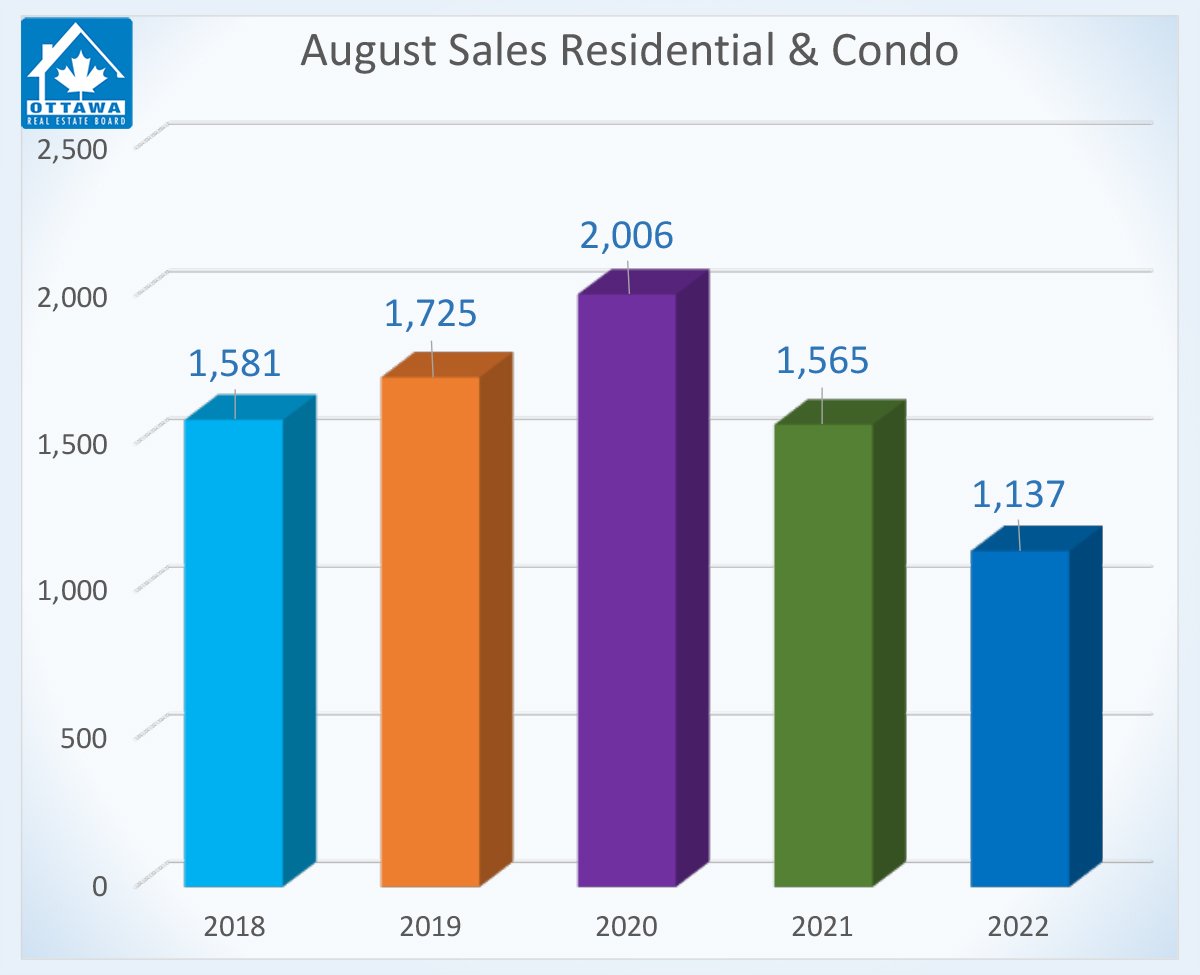
This month, the Ottawa Real Estate Board recorded 1137 residential real estate transactions, down 27% from 1565 in August 2021. This number is made up of 850 residential properties and 287 condominiums, decreases of 27-28% compared to this month last year. These numbers are also down significantly compared to the five-year average of 1600 sales.

The Ottawa Real Estate Board president, Penny Torontow, explains that August is traditionally a slower month in Ottawa for real estate due to summer vacations, school prep, and more. In addition, buyers are unsure about their ability to purchase homes, and at what budget, due to interest rate changes over the past few months.

The state of the market at the beginning of 2022 was unsustainable. As the market begins to slow, we can see the average days on market increasing, coming closer to 30 days. In addition, we’ve seen a return to the typical financing and inspection conditions on buyer contracts that were being skipped in order for buyers to make the most competitive offer. Homes are also seeing less multiple offer scenarios.

Condo prices are still increasing, up 4% from this month last year to an average of $421,966. Residential properties are also up 5% for an average of $707,712. Year-to-date, these numbers are even higher, up 9-10% at an average of $457,771 for condominiums and $795,978 for residential homes.

2,093 properties were listed this month, increasing our inventory to nearly 3 months for residential homes and 2.2 months for condominiums.

Torontow explains that prices are still high and rising, although the percent by which they are rising is getting smaller, down to the single-digit percentages now. We are moving towards a more balanced market, which means that buyers will have more choice and sellers will have to be more mindful about how they choose to price their properties.

Important to note is that these statistics can only be as accurate as there are condos sold in Ottawa. The more condos sold in an area, the more accurate the averages will be.

Want to chat about your options? Fill out the form at the bottom of the page, or text/call us directly 613-900-5700 or fill out the form at the bottom of the page.

Do you have any questions about how this information affects your investment or looking for more information to make the best decision about your purchase? Let’s chat! Fill out the form on the bottom of the page.

Ottawa Condo Market Statistics - July 2022

Every month we take a closer look and drill down the sales data of Ottawa condos from the previous month. Here are the statistics for July 2022 in the top five "downtown" areas - Centretown, Byward Market and Sandy Hill, Little Italy (which includes Lebreton Flats), Hintonburg, and Westboro. The information will be specific to apartment-style condominiums, and only what sold through the MLS. Also important to note that DOM (Day's On Market) is calculated to include the conditional period, which in Ottawa is roughly 14 days for almost every single transaction.


This month, Ottawa real estate agents sold 1110 residential properties. This is down 35% from this month last year, when agents sold 1718. 840 of these were residential properties (a 36% decrease) and 270 were condos (a 34% decrease). This is also greatly below the 5 year average of 1691 properties sold in the month of June. 

Penny Torontow explains that this is a major slowing of our real estate market. Buyers are even less motivated to buy than the usual ‘summer lull’ we see in a typical year. She explains that the interest rate hikes as well as other factors are contributing to buyers wanting to ‘wait and see.’ Torontow explains this isn’t necessarily a bad thing though, because as more homes hit the market and less buyers are motivated to buy, we’re getting closer to a balanced market. 

Listings added to the market are very regular compared to the 5 year average and only a slight decrease from last July, when the market was booming. This has boosted our inventory of residential properties to 2.9 months and condos to 2.5 months. We’re moving quickly towards a balanced market, which would mean 4 months of inventory. 

Average prices are still increasing, 1% from last year in condominiums and 5% from last year in residential homes. This is a significantly slower increase than previous years though, where we were seeing double digit percentage increases year over year. 

Sellers must prepare to be more patient as days on market return to typical lengths. Buyers have more choice and less pressure to buy. Because of this, they may be touring more houses and taking more time to make their decisions. Rising costs of just about everything also means more buyers are taking a breath to evaluate their finances in this changing world before making offers. 

In contrast, rentals are up significantly, with Ottawa agents renting out 3528 properties year to date, compared to 2706 the previous year. 

Important to note is that these statistics can only be as accurate as there are condos sold in Ottawa. The more condos sold in an area, the more accurate the averages will be.

Want to chat about your options? Fill out the form at the bottom of the page, or text/call us directly 613-900-5700 or fill out the form at the bottom of the page.

Do you have any questions about how this information affects your investment or looking for more information to make the best decision about your purchase? Let’s chat! Fill out the form on the bottom of the page.
Ottawa Condo Market Statistics - June 2022

Every month we take a closer look and drill down the sales data of Ottawa condos from the previous month. Here are the statistics for June 2022 in the top five "downtown" areas - Centretown, Byward Market and Sandy Hill, Little Italy (which includes Lebreton Flats), Hintonburg, and Westboro. The information will be specific to apartment-style condominiums, and only what sold through the MLS. Also important to note that DOM (Day's On Market) is calculated to include the conditional period, which in Ottawa is roughly 14 days for almost every single transaction.


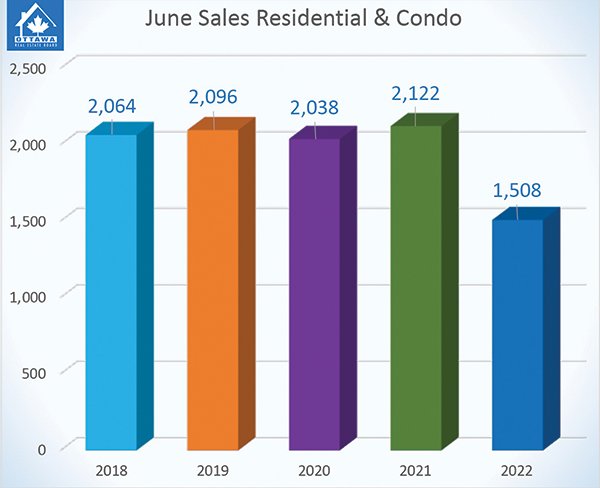
This month, members of the Ottawa Real Estate board sold 1,508 residential properties. This is down a significant amount from 2,122 in June 2021. Residential property sales are down 31% and condo sales are down 23%. 

Penny Torontow explains that Ottawa’s market is becoming more normal now, and we’re seeing a more typical ebb and flow cycle. 

We can also assume that a higher cost of living and inflation are contributing to the discouragement many people feel about buying homes. Also, Torontow explains, that ‘buyer fatigue’ caused be waiting to see about home prices may also contribute to lower confidence in consumers. All this, and the rising gas prices, may be slowing down Ottawa resident’s motivation to purchase a home. 

Prices are now at a 1% increase in condo prices and a 6% increase in residential home prices. Residential inventory has also increase 38% over this time last year, and condominium has increased 14%. 

Torontow explains now might be a great time to buy as there is more inventory and less bidding wars.

Important to note is that these statistics can only be as accurate as there are condos sold in Ottawa. The more condos sold in an area, the more accurate the averages will be.

Want to chat about your options? Fill out the form at the bottom of the page, or text/call us directly 613-900-5700 or fill out the form at the bottom of the page.

Do you have any questions about how this information affects your investment or looking for more information to make the best decision about your purchase? Let’s chat! Fill out the form on the bottom of the page.

Ottawa Condo Market Statistics - May 2022

Every month we take a closer look and drill down the sales data of Ottawa condos from the previous month. Here are the statistics for May 2022 in the top five "downtown" areas - Centretown, Byward Market and Sandy Hill, Little Italy (which includes Lebreton Flats), Hintonburg, and Westboro. The information will be specific to apartment-style condominiums, and only what sold through the MLS. Also important to note that DOM (Day's On Market) is calculated to include the conditional period, which in Ottawa is roughly 14 days for almost every single transaction.


This past month, there were 1846 residential property sales in Ottawa, compared to 2285 last year - this is a decrease of 19 percent year over year, and is significantly lower than the 5 year average of 2031 sales as well. 

Penny Torontow, Ottawa Real Estate Board’s president, explains that we can see this trend continuing as the market slows from where it was in 2021. With rising interest rates, a higher cost of living, and inflation, sales were already slowing. Add in the intense storm Ottawa suffered mid-month, it only makes sense that people are taking a step back while the community heals. 

Data shows that there was a sharp decline in new listings and a large increase in cancelled/suspended listings after the storm hit Ottawa. 

We also saw a slight decrease in the inventory of condominium units in the city, which isn’t surprising as more and more people, especially first-time home buyers, are investing in condominiums as their pricing is more accessible. 

Despite fewer sales, prices still increased on average from last year, 11% for condos and 8% for residential properties, and a 12% overall increase in price. But prices are slowly adjusting to the market, and are decreasing an average of 1-2% per month. 

We are also seeing more cumulative days on market. Because of this, we are getting closer and closer to a balanced market, because more days on market allows buyers more breathing room to decide what works best for them.

Important to note is that these statistics can only be as accurate as there are condos sold in Ottawa. The more condos sold in an area, the more accurate the averages will be.

Want to chat about your options? Fill out the form at the bottom of the page, or text/call us directly 613-900-5700 or fill out the form at the bottom of the page.

Do you have any questions about how this information affects your investment or looking for more information to make the best decision about your purchase? Let’s chat! Fill out the form on the bottom of the page.

Ottawa Condo Market Statistics - April 2022

Every month we take a closer look and drill down the sales data of Ottawa condos from the previous month. Here are the statistics for April 2022 in the top five "downtown" areas - Centretown, Byward Market and Sandy Hill, Little Italy (which includes Lebreton Flats), Hintonburg, and Westboro. The information will be specific to apartment-style condominiums, and only what sold through the MLS. Also important to note that DOM (Day's On Market) is calculated to include the conditional period, which in Ottawa is roughly 14 days for almost every single transaction.


April was an unexpected month for the real estate market in Ottawa. We saw more days on market for about half of the neighbourhoods we survey, higher list to sold prices, and more properties sold this year everywhere except for the Byward Market. Average selling prices were up considerably in every area.

This month, the Ottawa Real Estate Board sold a total of 1889 properties. This is down 21% from this month last year, which was 2394. It is, however, still higher than the five-year average of 1849, although just slightly!

Penny Torontow explains that things like the rising interest rates, growing buyer frustration, and cooler temperatures this month may have had something to do with the lower sales despite a good number of new listings. Perhaps buyers are waiting to see what happens next. She explains it is still a seller’s market, despite this slowing in the market, and that there are still plenty of bidding wars and multiple offer scenarios in many areas. The average condo sold for 11% more than last year, and residential properties saw a 12% average price increase.

There is still less than a month of inventory in Ottawa, meaning competition is still high. This limited supply and high demand for houses means that the pressure is still on - and prices will remain high.

Condos are also performing slightly better as time goes on, because they are slowly becoming the most reasonable investment for many people - they are the most affordable option, and for many, are becoming the entry-level property type.

Important to note is that these statistics can only be as accurate as there are condos sold in Ottawa. The more condos sold in an area, the more accurate the averages will be.

Want to chat about your options? Fill out the form at the bottom of the page, or text/call us directly 613-900-5700 or fill out the form at the bottom of the page.

Do you have any questions about how this information affects your investment or looking for more information to make the best decision about your purchase? Let’s chat! Fill out the form on the bottom of the page.

Ottawa Condo Market Statistics - March 2022

Every month we take a closer look and drill down the sales data of Ottawa condos from the previous month. Here are the statistics for March 2022 in the top five "downtown" areas - Centretown, Byward Market and Sandy Hill, Little Italy (which includes Lebreton Flats), Hintonburg, and Westboro. The information will be specific to apartment-style condominiums, and only what sold through the MLS. Also important to note that DOM (Day's On Market) is calculated to include the conditional period, which in Ottawa is roughly 14 days for almost every single transaction.


March was off to an interesting start for the condo market in Ottawa! As the spring rush begins, we would expect to see plenty of listings. But compared to last year, listings for the month of march were actually down considerably everywhere but Centretown! We did see an increase in list to sold price in every area except Westboro, however!

The quantity of homes sold has also decreased since this month last year in all places except for Centretown.

Overall, this shows us that the sellers market may actually be slowing down, at least for apartment style condos in Ottawa! Because of this, if you’ve been considering buying a condo, it looks like now is your time. That being said, sellers shouldn’t be worried, as many homes are still going for a considerable amount over listing price!

This month, the Ottawa Real Estate Board sold 2011 residential properties - this is down from 2274 in March of 2021. This is still an increase of 42% from February of this year and 12% higher than the five year average!

This change may be due to the warmer weather last March which encouraged an earlier Spring buying and selling season. It is also worth noting that many restrictions have lifted this month, meaning more people are out and about on vacation and less focused on real estate at the moment.

The average sale price for condos in Ottawa was $479,405. This is a 10% increase from 2021. Residential properties average sale price was also up a considerable amount, 13%, at $853,615. The average price of homes in Ottawa is still on a steady incline.

We are also seeing slightly more houses enter the market over the past 5 years; a 4% increase.

Important to note is that these statistics can only be as accurate as there are condos sold in Ottawa. The more condos sold in an area, the more accurate the averages will be.

Want to chat about your options? Fill out the form at the bottom of the page, or text/call us directly 613-900-5700 or fill out the form at the bottom of the page.

Do you have any questions about how this information affects your investment or looking for more information to make the best decision about your purchase? Let’s chat! Fill out the form on the bottom of the page.

Ottawa Condo Market Statistics - February 2022

Every month we take a closer look and drill down the sales data of Ottawa condos from the previous month. Here are the statistics for February 2022 in the top five "downtown" areas - Centretown, Byward Market and Sandy Hill, Little Italy (which includes Lebreton Flats), Hintonburg, and Westboro. The information will be specific to apartment-style condominiums, and only what sold through the MLS. Also important to note that DOM (Day's On Market) is calculated to include the conditional period, which in Ottawa is roughly 14 days for almost every single transaction.


We are now in our second month of 2022, and the market shows no signs of slowing down! Almost all neighbourhoods saw an increase in the number of listings and an increase in their list to sold price. The average days on market went down significantly in every area except for Hintonburg.

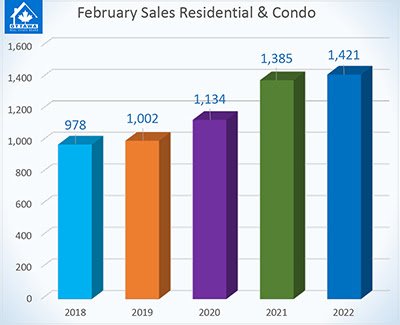
The Ottawa Real Estate Board recorded 1421 residential properties sold this month, compared to 1385 last February - a 3% increase!

326 of these sales were condominiums, which is a 10% decrease from this month last year.

From January to February this year, we saw a 52% increase in transactions. Although this is typical as we move into the spring season and see more and more properties up for sale, this is a larger increase than we have seen in previous years.

OREB President Penny Torontow says this is a sign we may see the spring market “ramp up earlier this year.”

This may also be a sign that people are wary of the new interest rate increase, or perhaps be due to eased pandemic restrictions. We should expect to see the spring market in Ottawa continue to increase in the coming months.

Despite this, with the new increased interest rate and rumours of continued increases, we may also see lessened buyer power in the coming months.

The average condo price was $466,682 while the average residential property was listed at $837,517. These prices are increased 15-17% from the previous year.

The number of new listings may mean that we will see a reversal or slowing of the seller’s market in the coming months, but this will be largely dependent on, as previously mentioned, the buyer power available after the interest rate increases. It is also worth mentioning that although there were more new listings than in previous years, the number of available condominiums is down 20%!

Important to note is that these statistics can only be as accurate as there are condos sold in Ottawa. The more condos sold in an area, the more accurate the averages will be.

Want to chat about your options? Fill out the form at the bottom of the page, or text/call us directly 613-900-5700 or fill out the form at the bottom of the page.

Do you have any questions about how this information affects your investment or looking for more information to make the best decision about your purchase? Let’s chat! Fill out the form on the bottom of the page.

Ottawa Condo Market Statistics - January 2022

Every month we take a closer look and drill down the sales data of Ottawa condos from the previous month. Here are the statistics for January 2022 in the top five "downtown" areas - Centretown, Byward Market and Sandy Hill, Little Italy (which includes Lebreton Flats), Hintonburg, and Westboro. The information will be specific to apartment-style condominiums, and only what sold through the MLS. Also important to note that DOM (Day's On Market) is calculated to include the conditional period, which in Ottawa is roughly 14 days for almost every single transaction.


2022 is off to a great start. Ottawa is currently a sellers’ market, meaning that owners are getting great prices on their homes and offers are highly competitive. Despite this, we have seen a huge increase in sales in the Byward and Sandy Hill area! In other areas, we have seen less sales and listings - this is what causes a sellers’ market! Less availability means that condos and houses are ‘hot commodities’ - there are only a few, so there is more competition to get them!

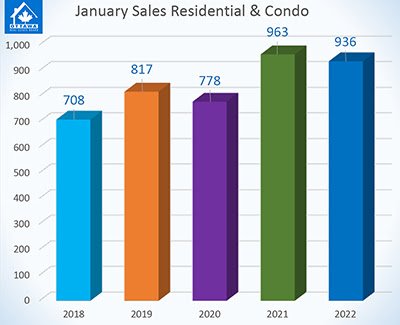
The Ottawa Real Estate Board reported there were 936 residential properties sold in January 2022, compared to 963 in January 2021. 275 of these were condominium, down 5% from January 2021.

Sales in Ottawa this month were almost identical to those of last year. OREB President Penny Torontow says “pent-up buyer demand due to the housing supply shortage” is responsible for price increases and an accelerating market.

The average prices of homes in Ottawa is continuing to rise, pushed by a lack of inventory. Homes in Ottawa over 1 million jumped from 3% of residential Ottawa sales in 2020 to 14% of detached home sales in 2022.

The condo market is doing spectacularly in Ottawa, perhaps due to the fact that many residential homes may be out of reach for Ottawa buyers.

Important to note is that these statistics can only be as accurate as there are condos sold in Ottawa. The more condos sold in an area, the more accurate the averages will be.

Want to chat about your options? Fill out the form at the bottom of the page, or text/call us directly 613-900-5700 or fill out the form at the bottom of the page.

Do you have any questions about how this information affects your investment or looking for more information to make the best decision about your purchase? Let’s chat! Fill out the form on the bottom of the page.

Ottawa Condo Market Statistics - December 2021

Every month we take a closer look and drill down the sales data of Ottawa condos from the previous month. Here are the statistics for December 2021 in the top five "downtown" areas - Centretown, Byward Market and Sandyhill, Little Italy (which includes Lebreton Flats), Hintonburg, and Westboro. The information will be specific to apartment-style condominiums, and only what sold through the MLS. Also important to note that DOM (Day's On Market) is calculated to include the conditional period, which in Ottawa is almost every single transaction to be roughly 14 days.


Every month we break down the numbers for the top downtown areas for condos, but I have started including the Ottawa Real Estate board overall stats for the month to paint a picture of the overall condo market. Also interesting to note is that the average sale price year to date for condominiums across the city increased 16 percent over 2020, hitting $419,683.

One important thing to note as you look at the numbers below is that they are based on smaller data points that might not properly indicate that specific properties have increased or decreased. For example, both Westboro and Hintonburg had only one condo sold during the month, which makes the “average” sold price look like a HUGE jump over last year. Compare that to Centretown which had 23 sold units, the average sold price is much more inline with what the market is seeing.

Want to chat about your options? Fill out the form at the bottom of the page, or txt/call us directly 613-900-5700 or fill out the form at the bottom of the page.

Do you have any questions about how this information affects your investment or looking for more information to make the best decision about your purchase? Let’s chat! Fill out the form on the bottom of the page.

Claridge Icon - Now Occupying

** For more information about Claridge Icon, visit our Claridge Icon page, with all of the renderings, floorplans, detailed information, etc. CLICK HERE.**

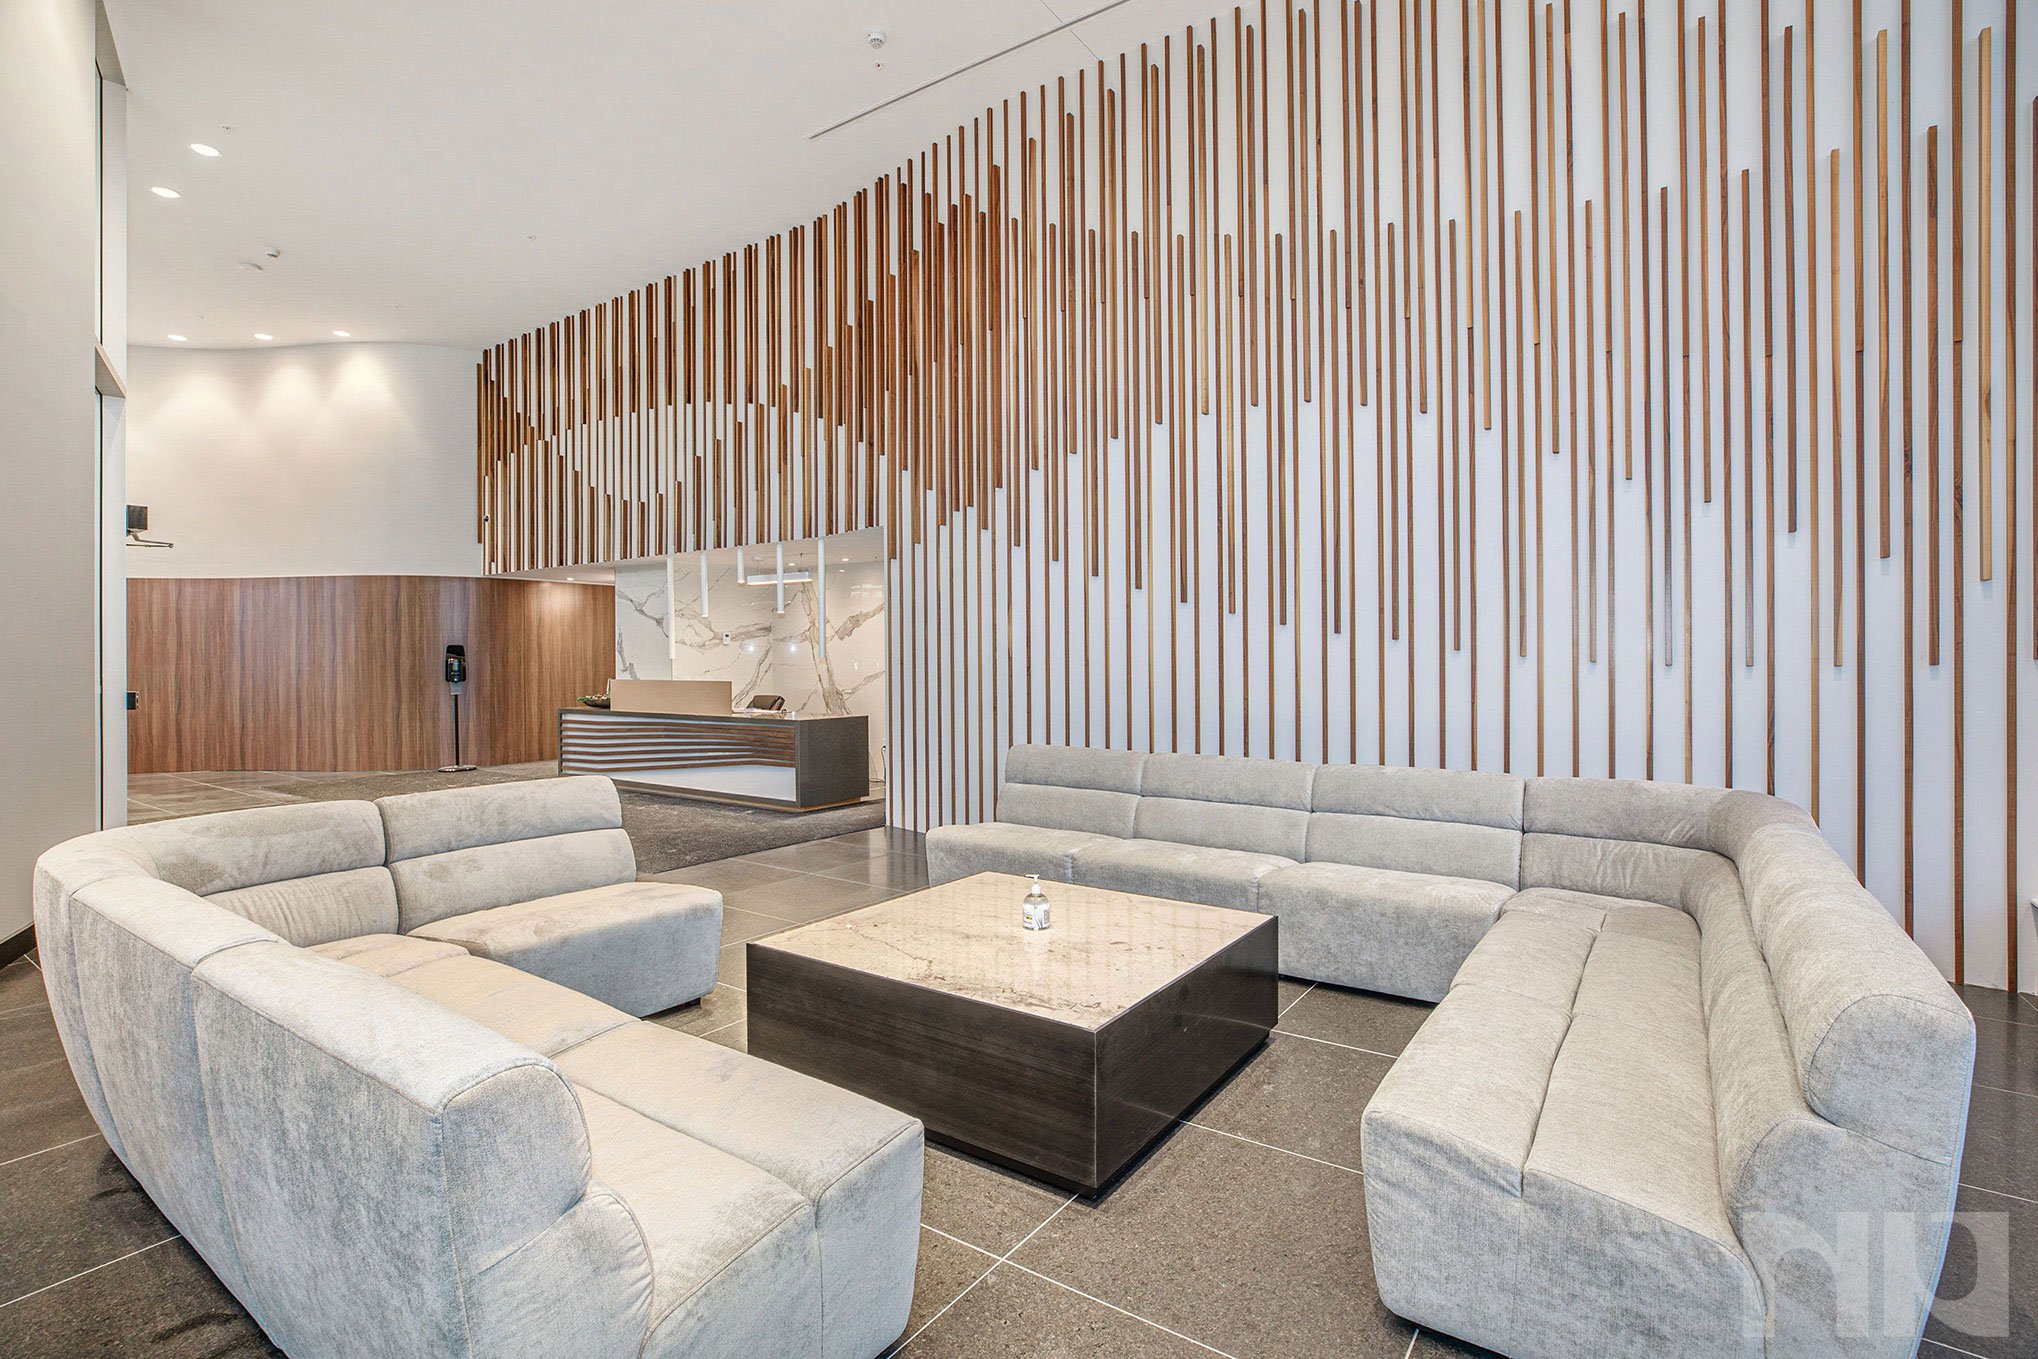
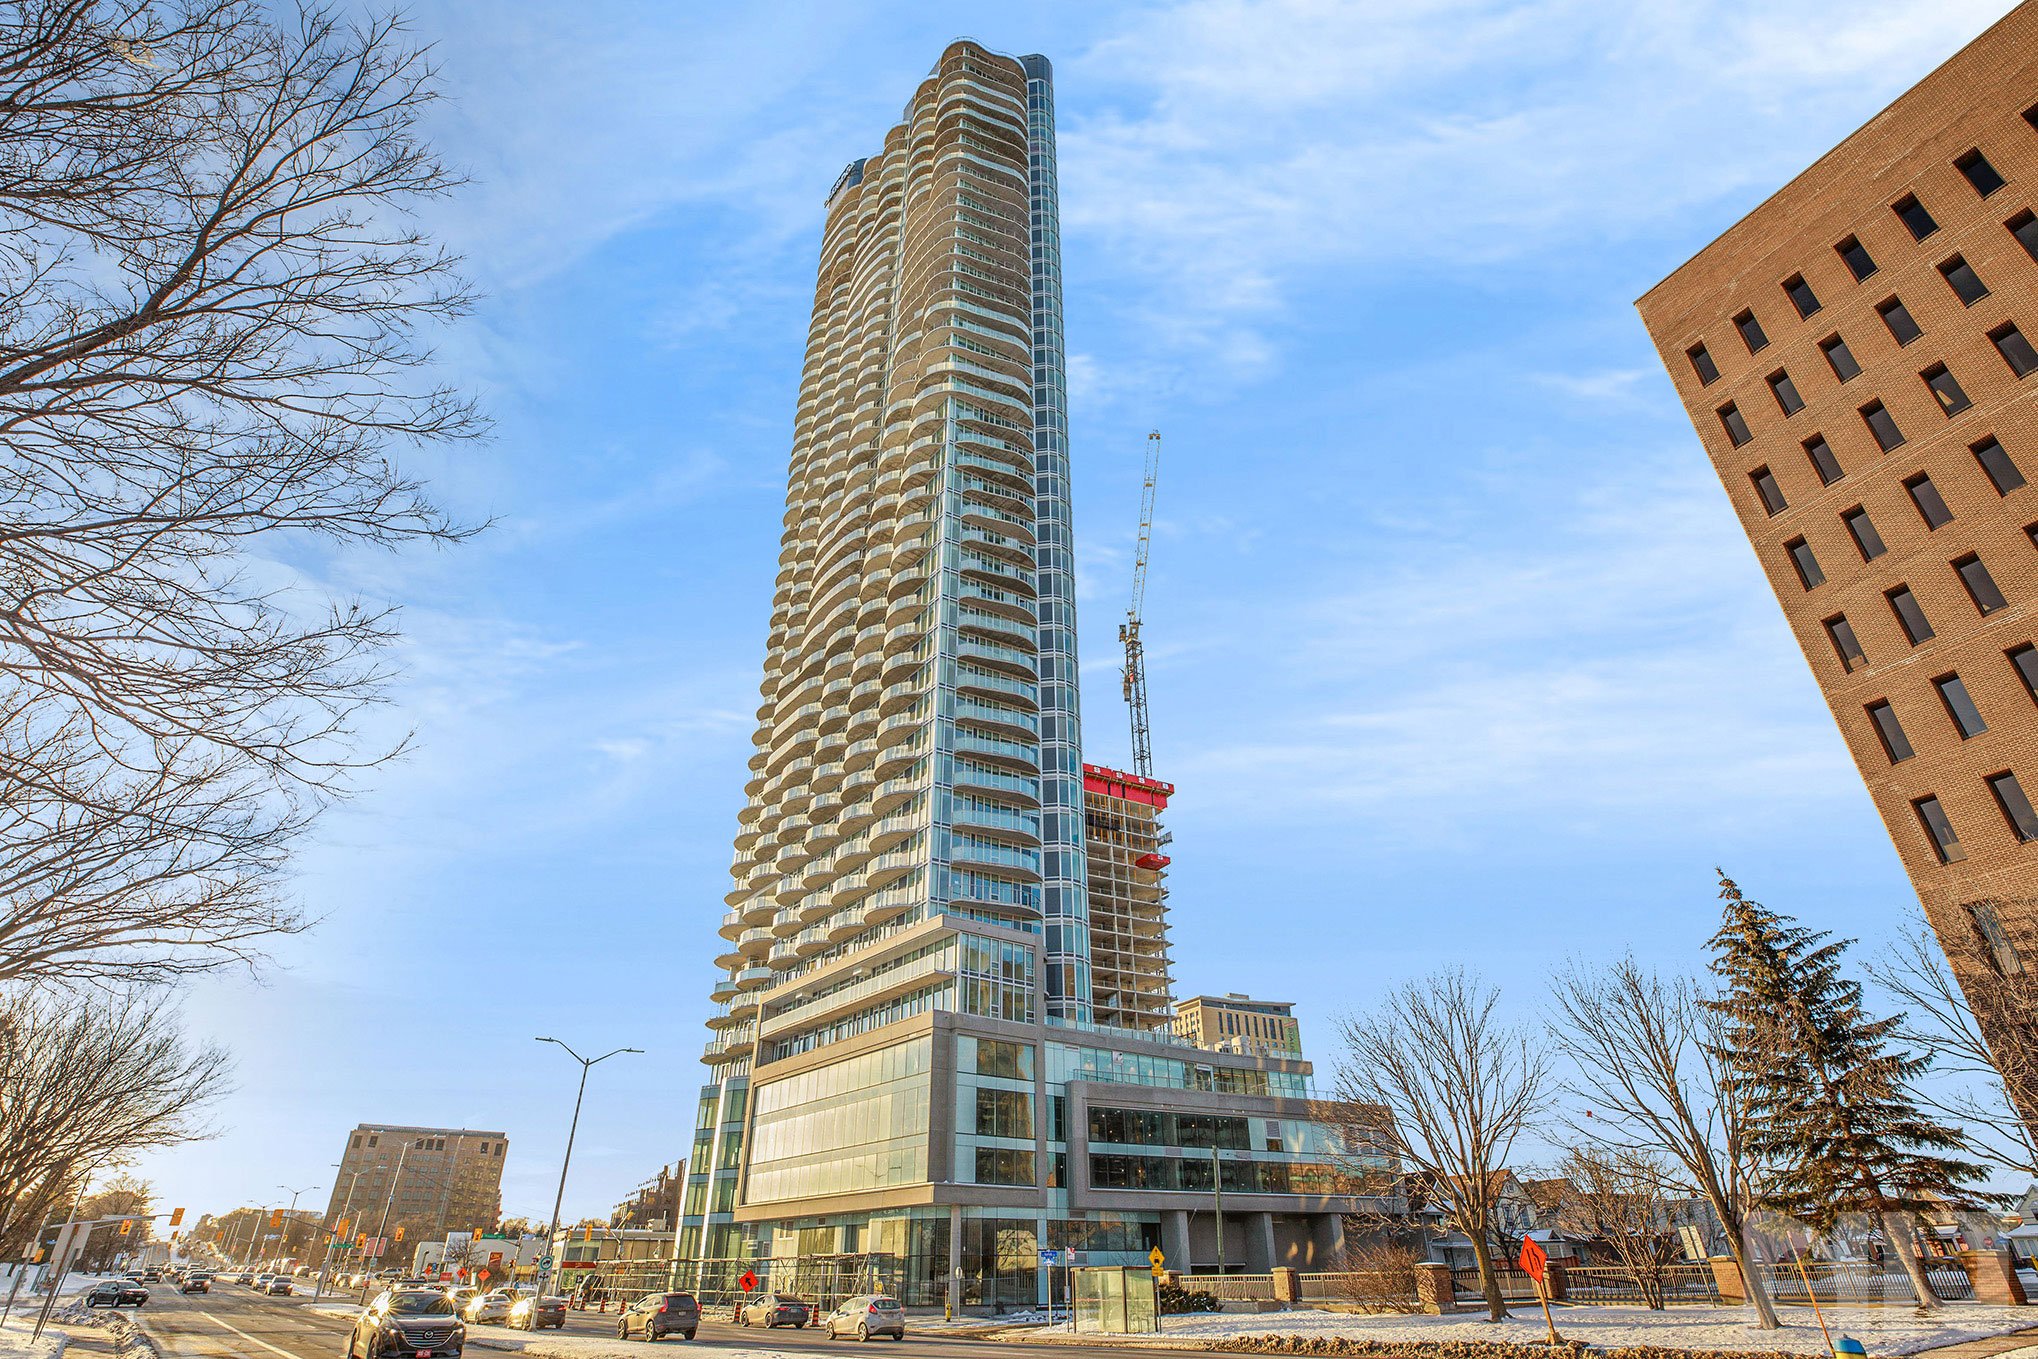
Claridge Icon has officially entered the occupancy phase as its first owners have started moving in. The building is still being completed, and there are still a few units available for purchase. Pricing starts at $528,000 for the Adler floorplan which is 740 sqft on the 6th floor.

Sales originally started in the summer of 2013 and feature 318 units over 45 stories. Located at 805 Carling, the development is located at the base of Little Italy alongside Dows Lake, the LRT, etc.

For more information about Claridge Icon, or pre-construction condos in Ottawa, fill out the form below!

Kensington Lofts Hintonburg - Over 60% Sold Out

Kensington-Lofts-Header.jpg
98-Pinhey-11.jpg

**For more information about Kensington Lofts Hintonburg visit our Kensington Lofts Hintonburg page which Includes everything about Kensington Lofts in one place, floorplans, renderings, pricing, etc.**

98-Pinhey-55.jpg
98-Pinhey-31.jpg

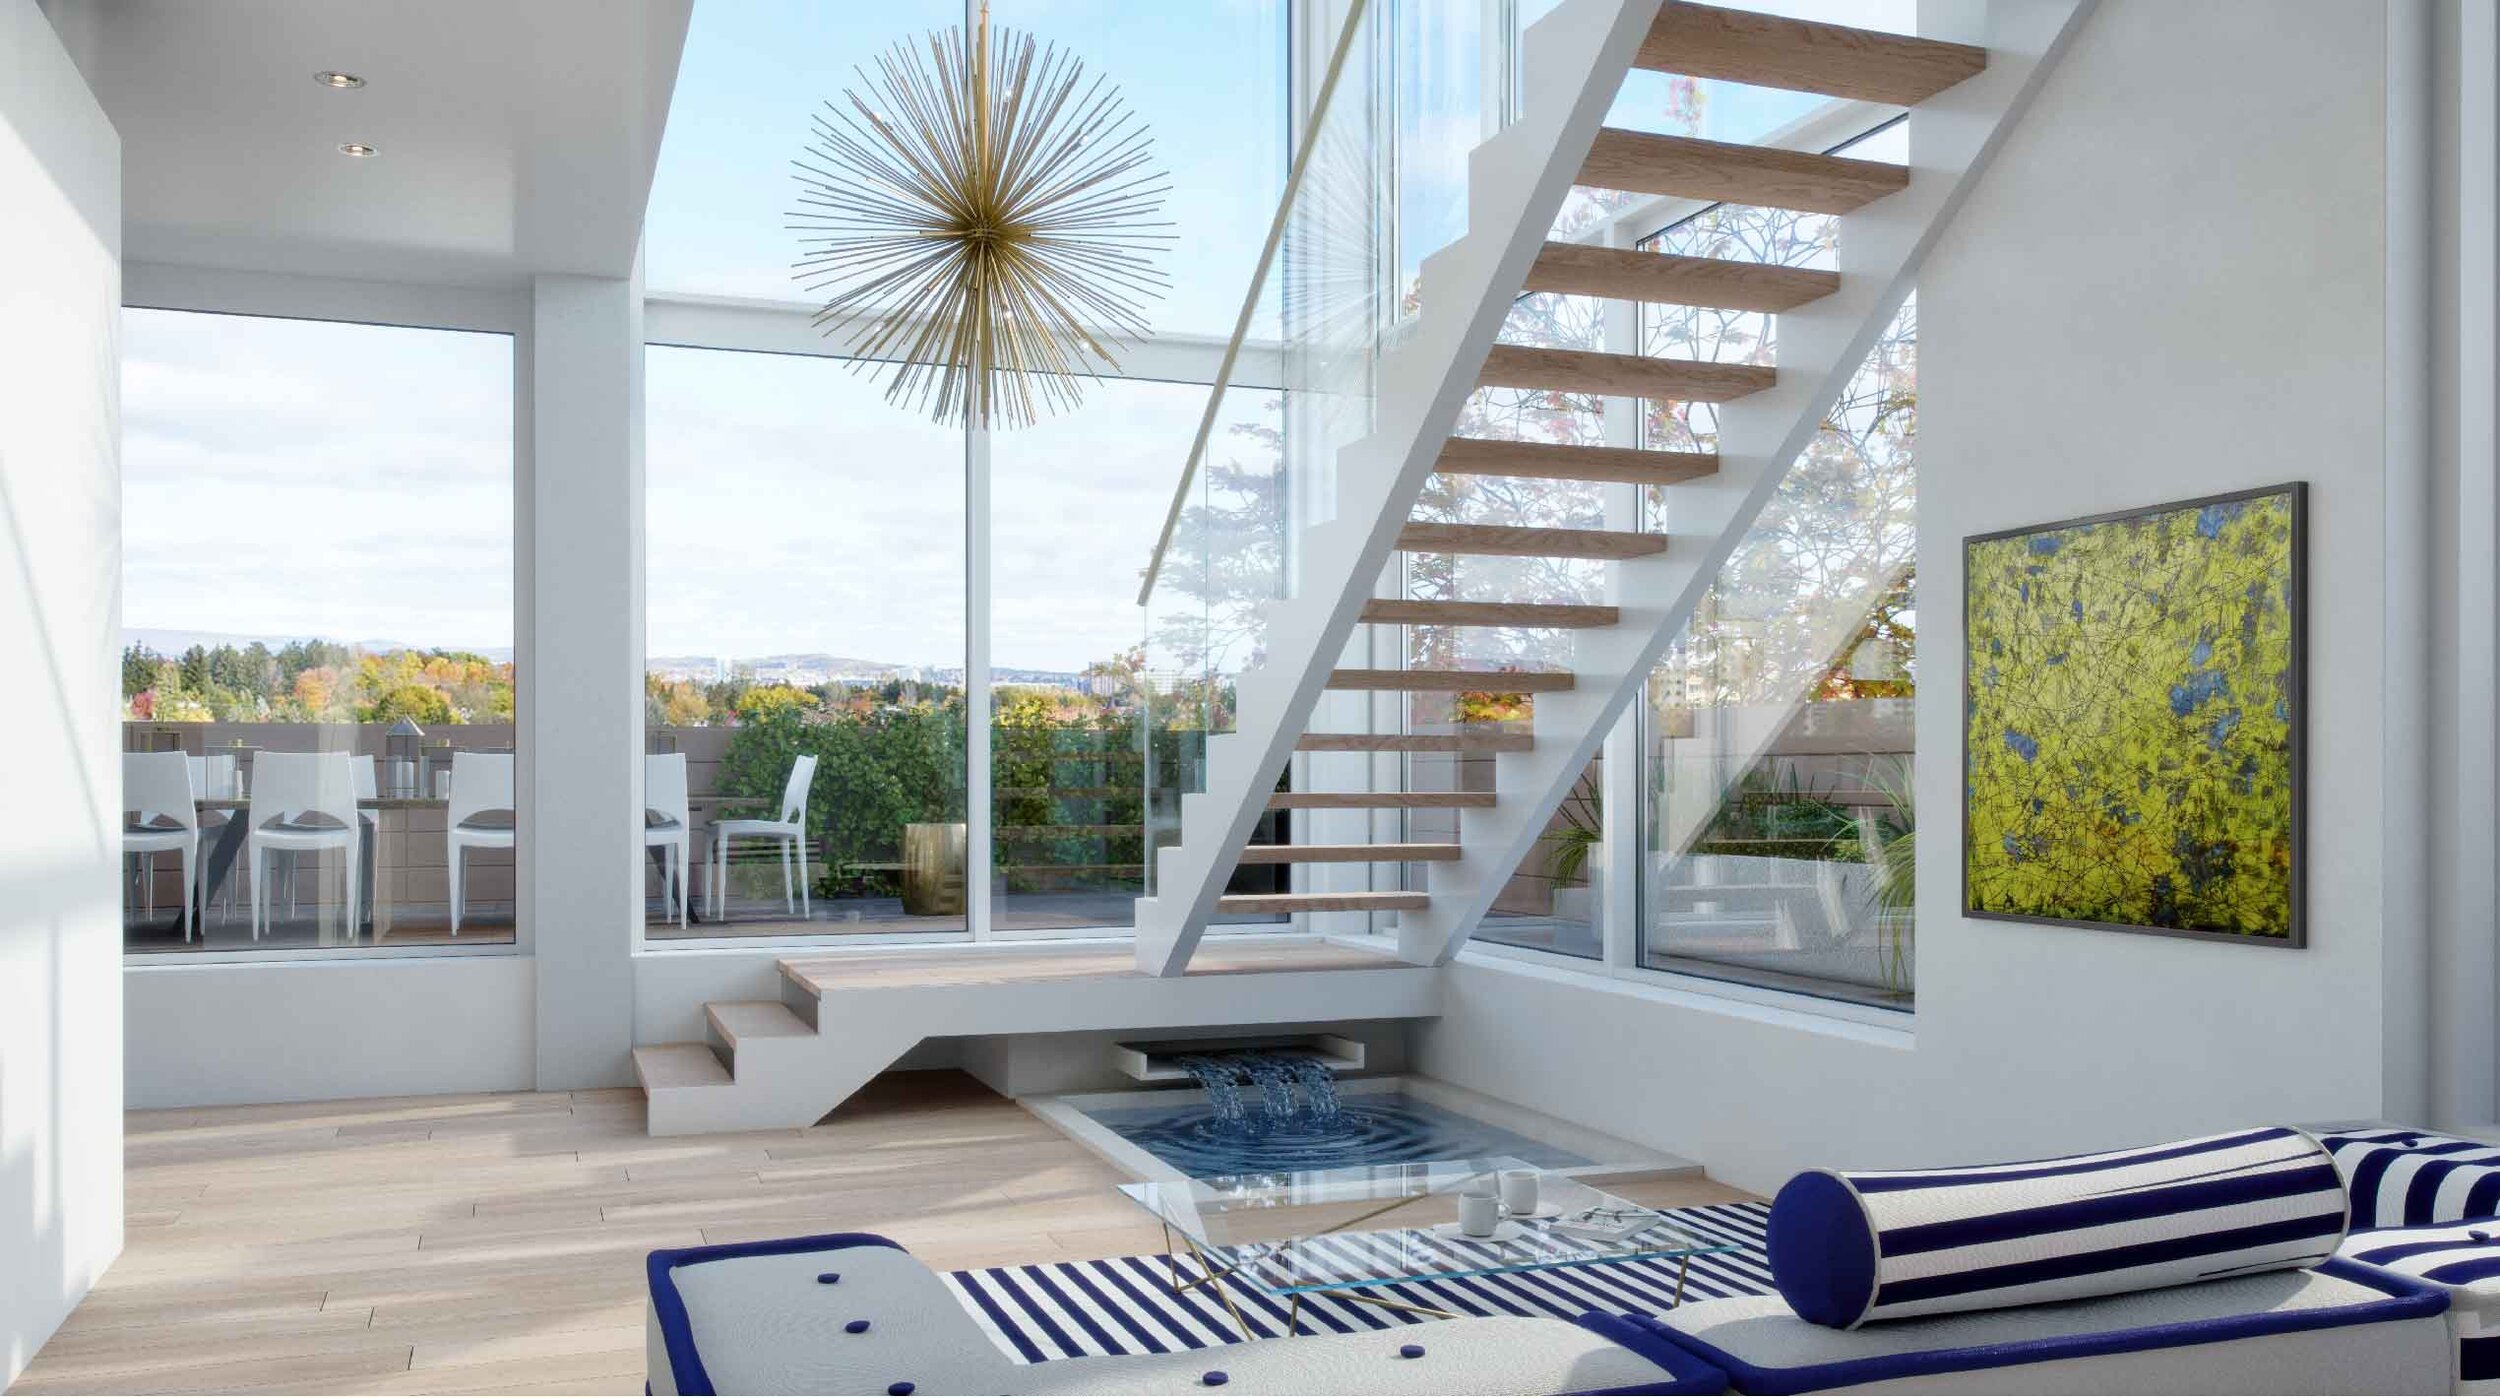
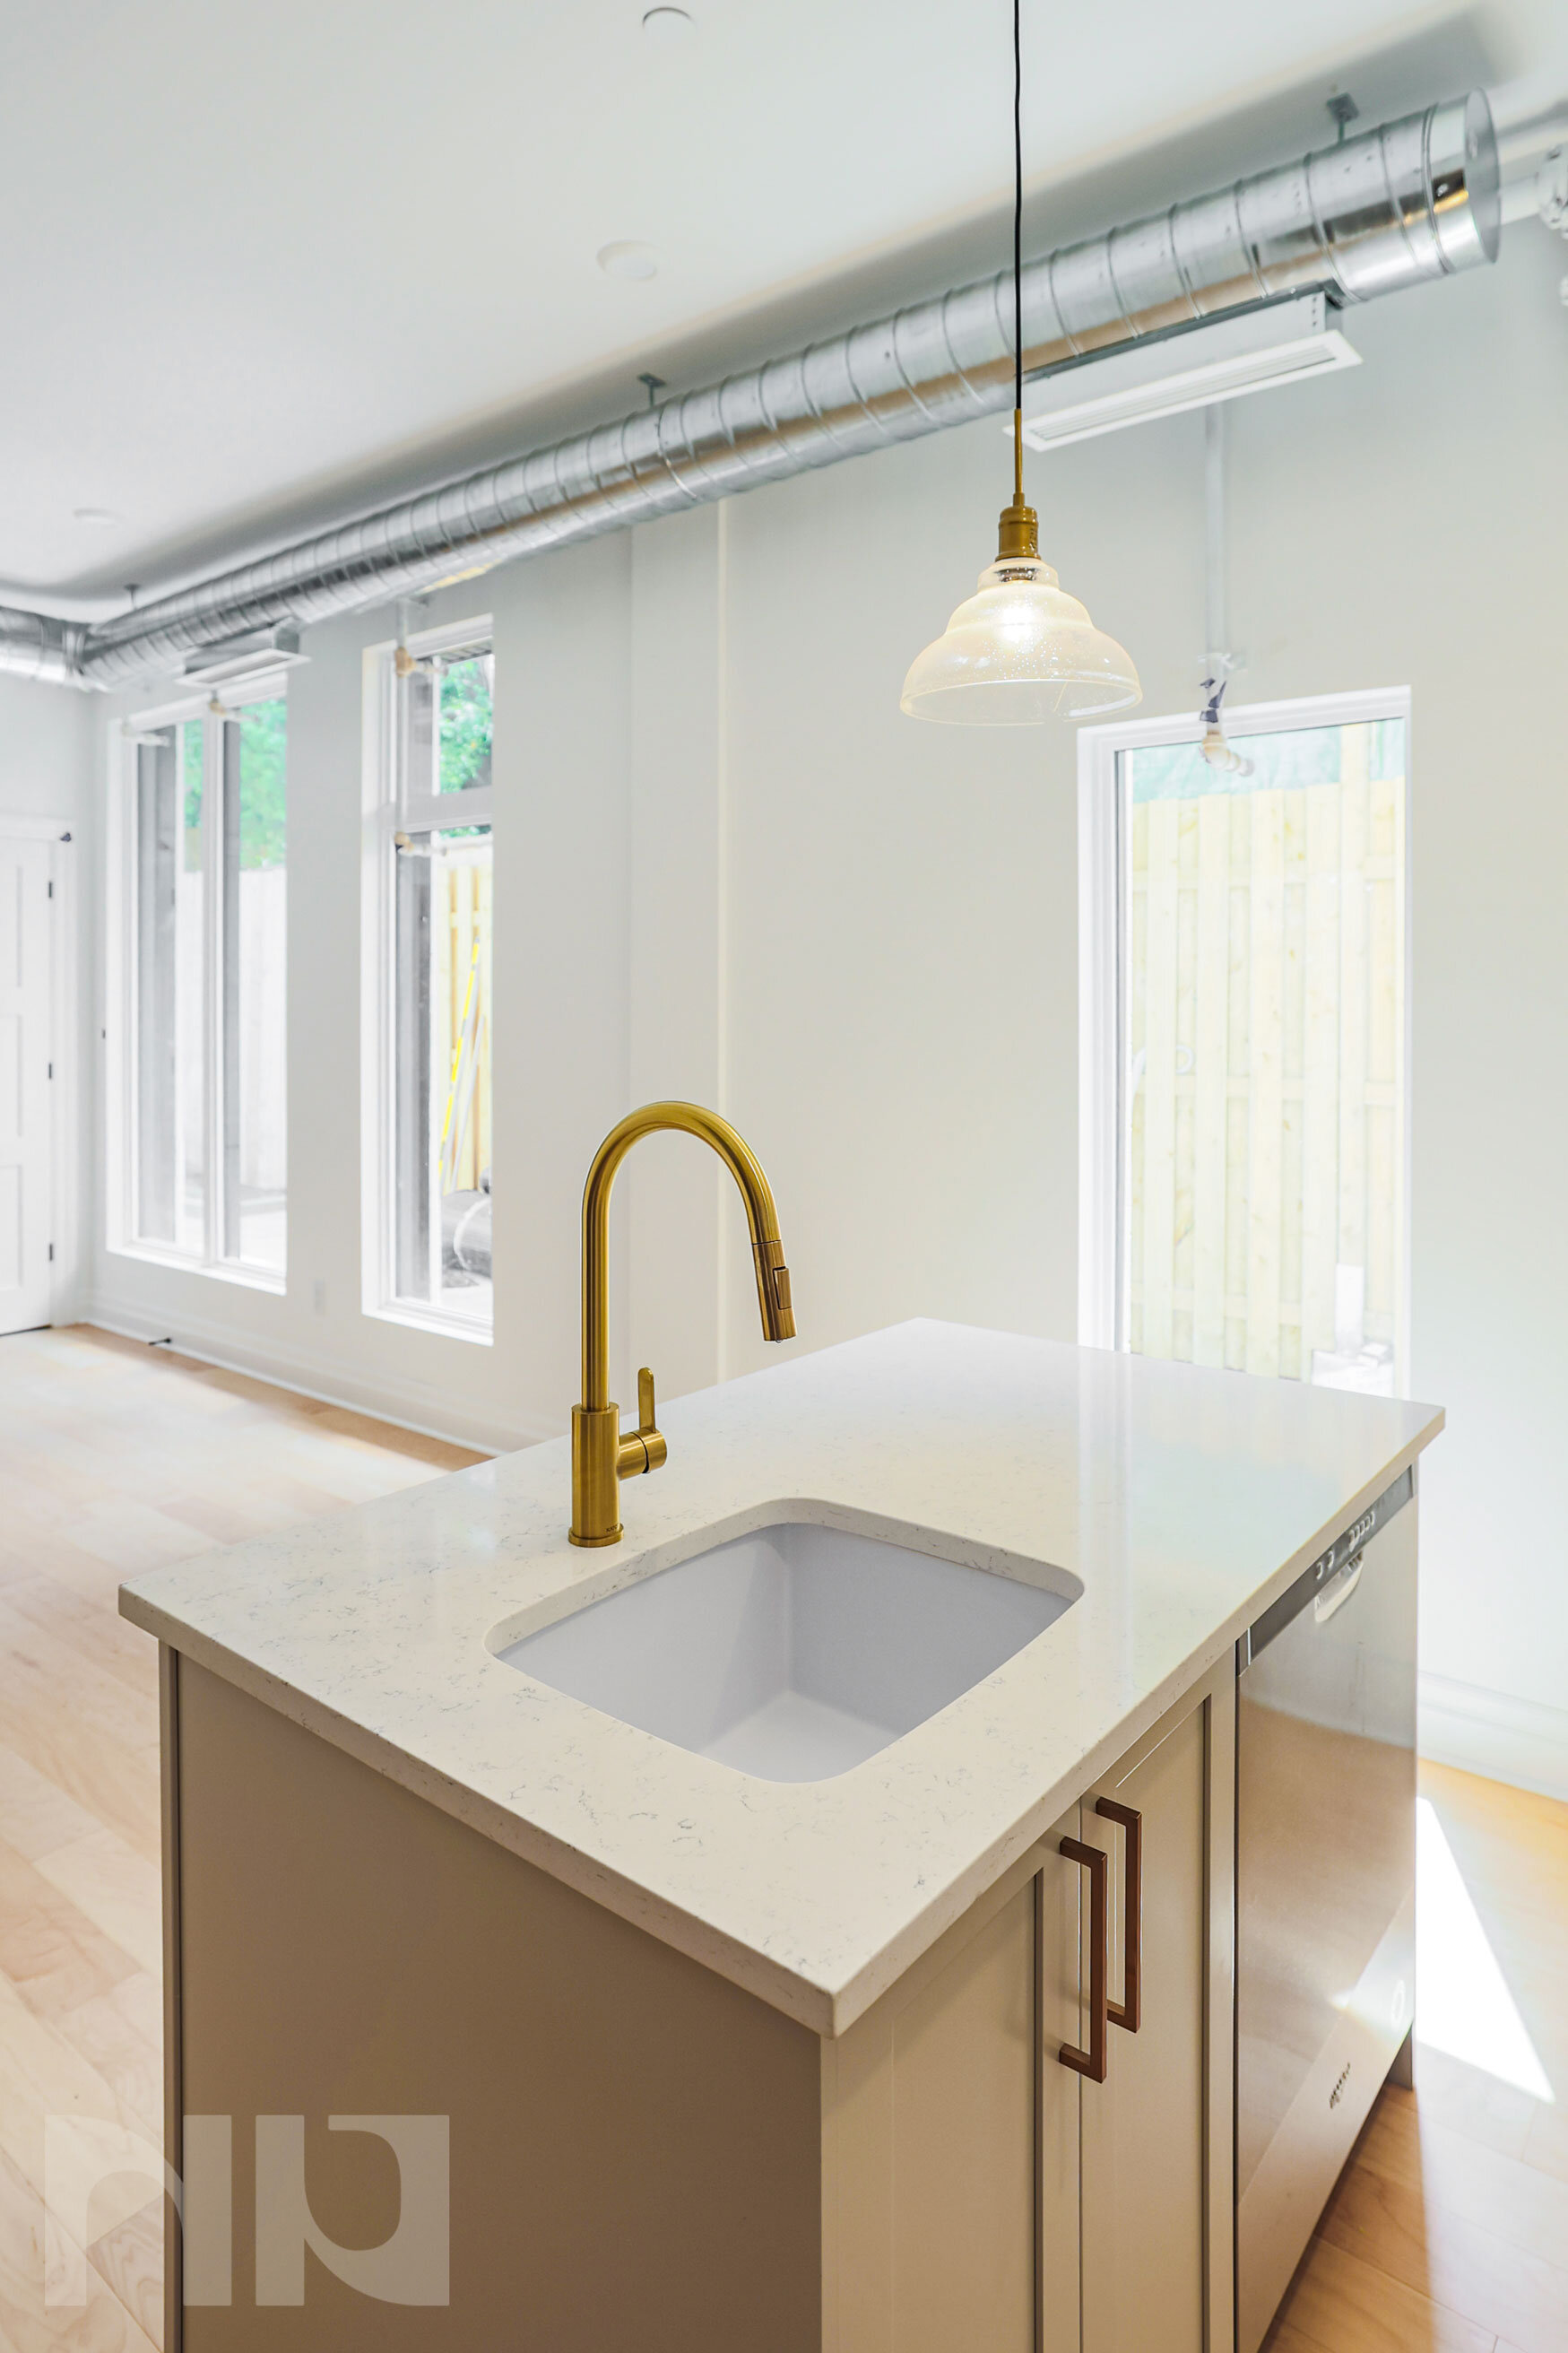
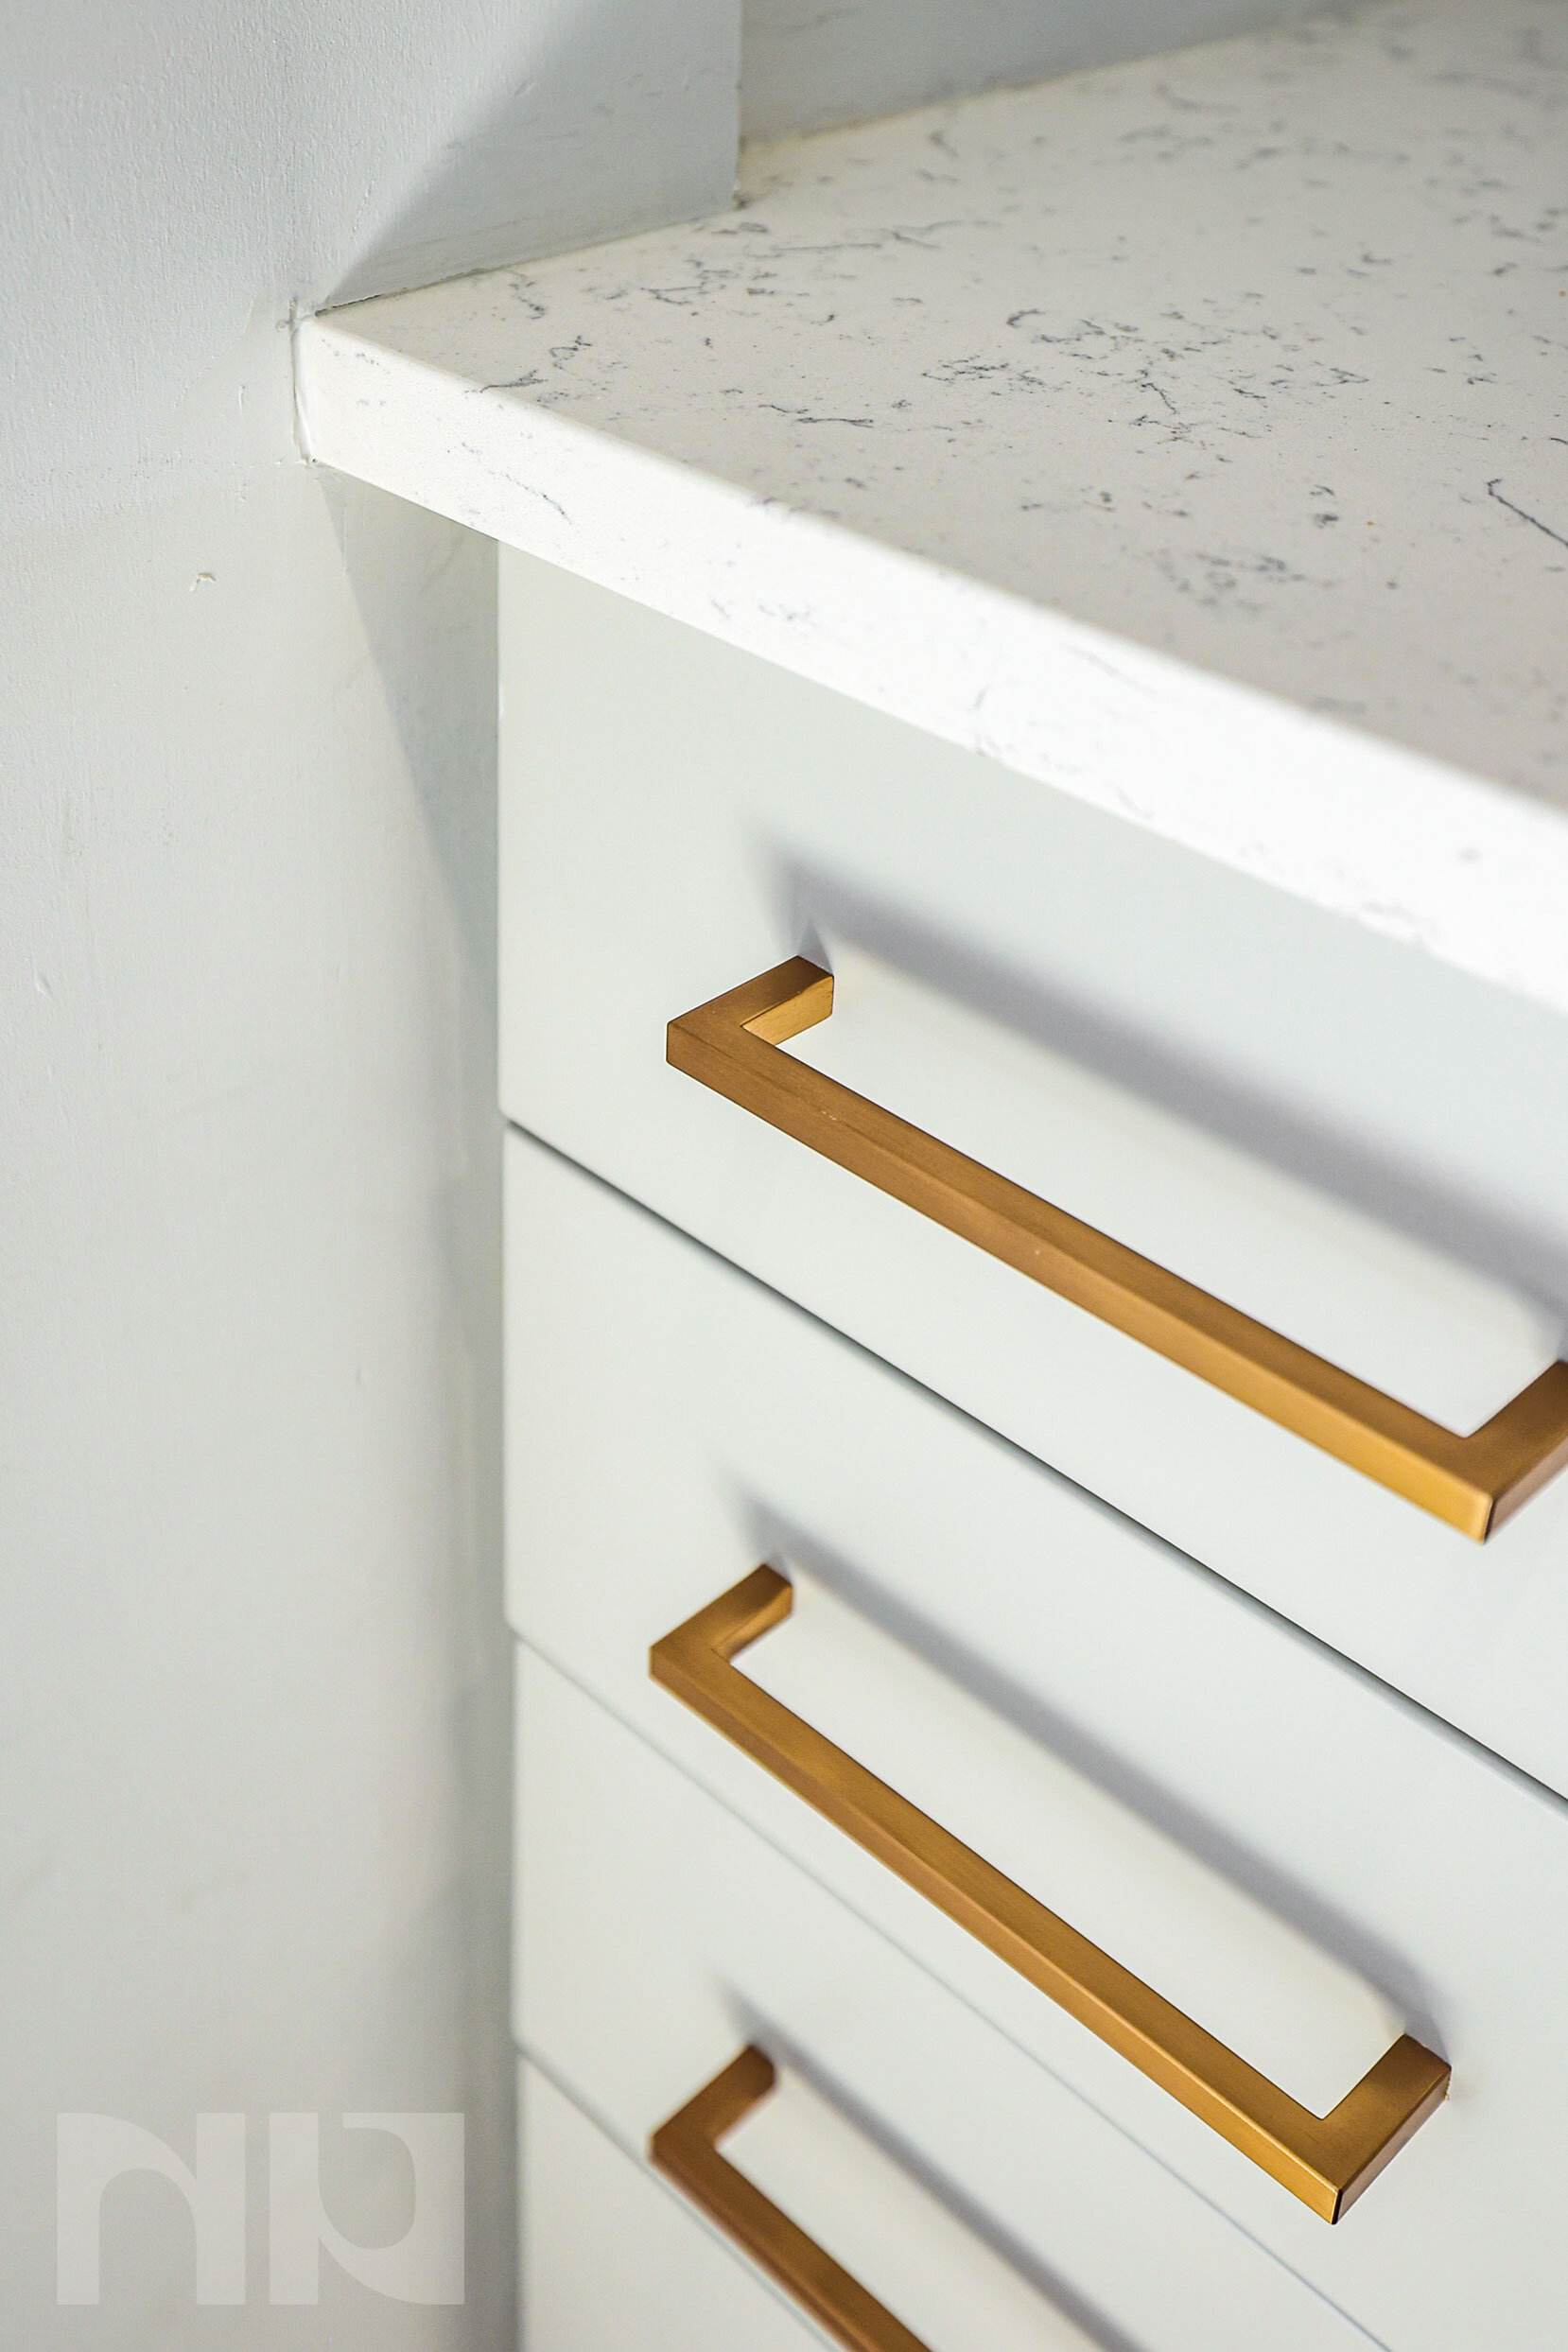
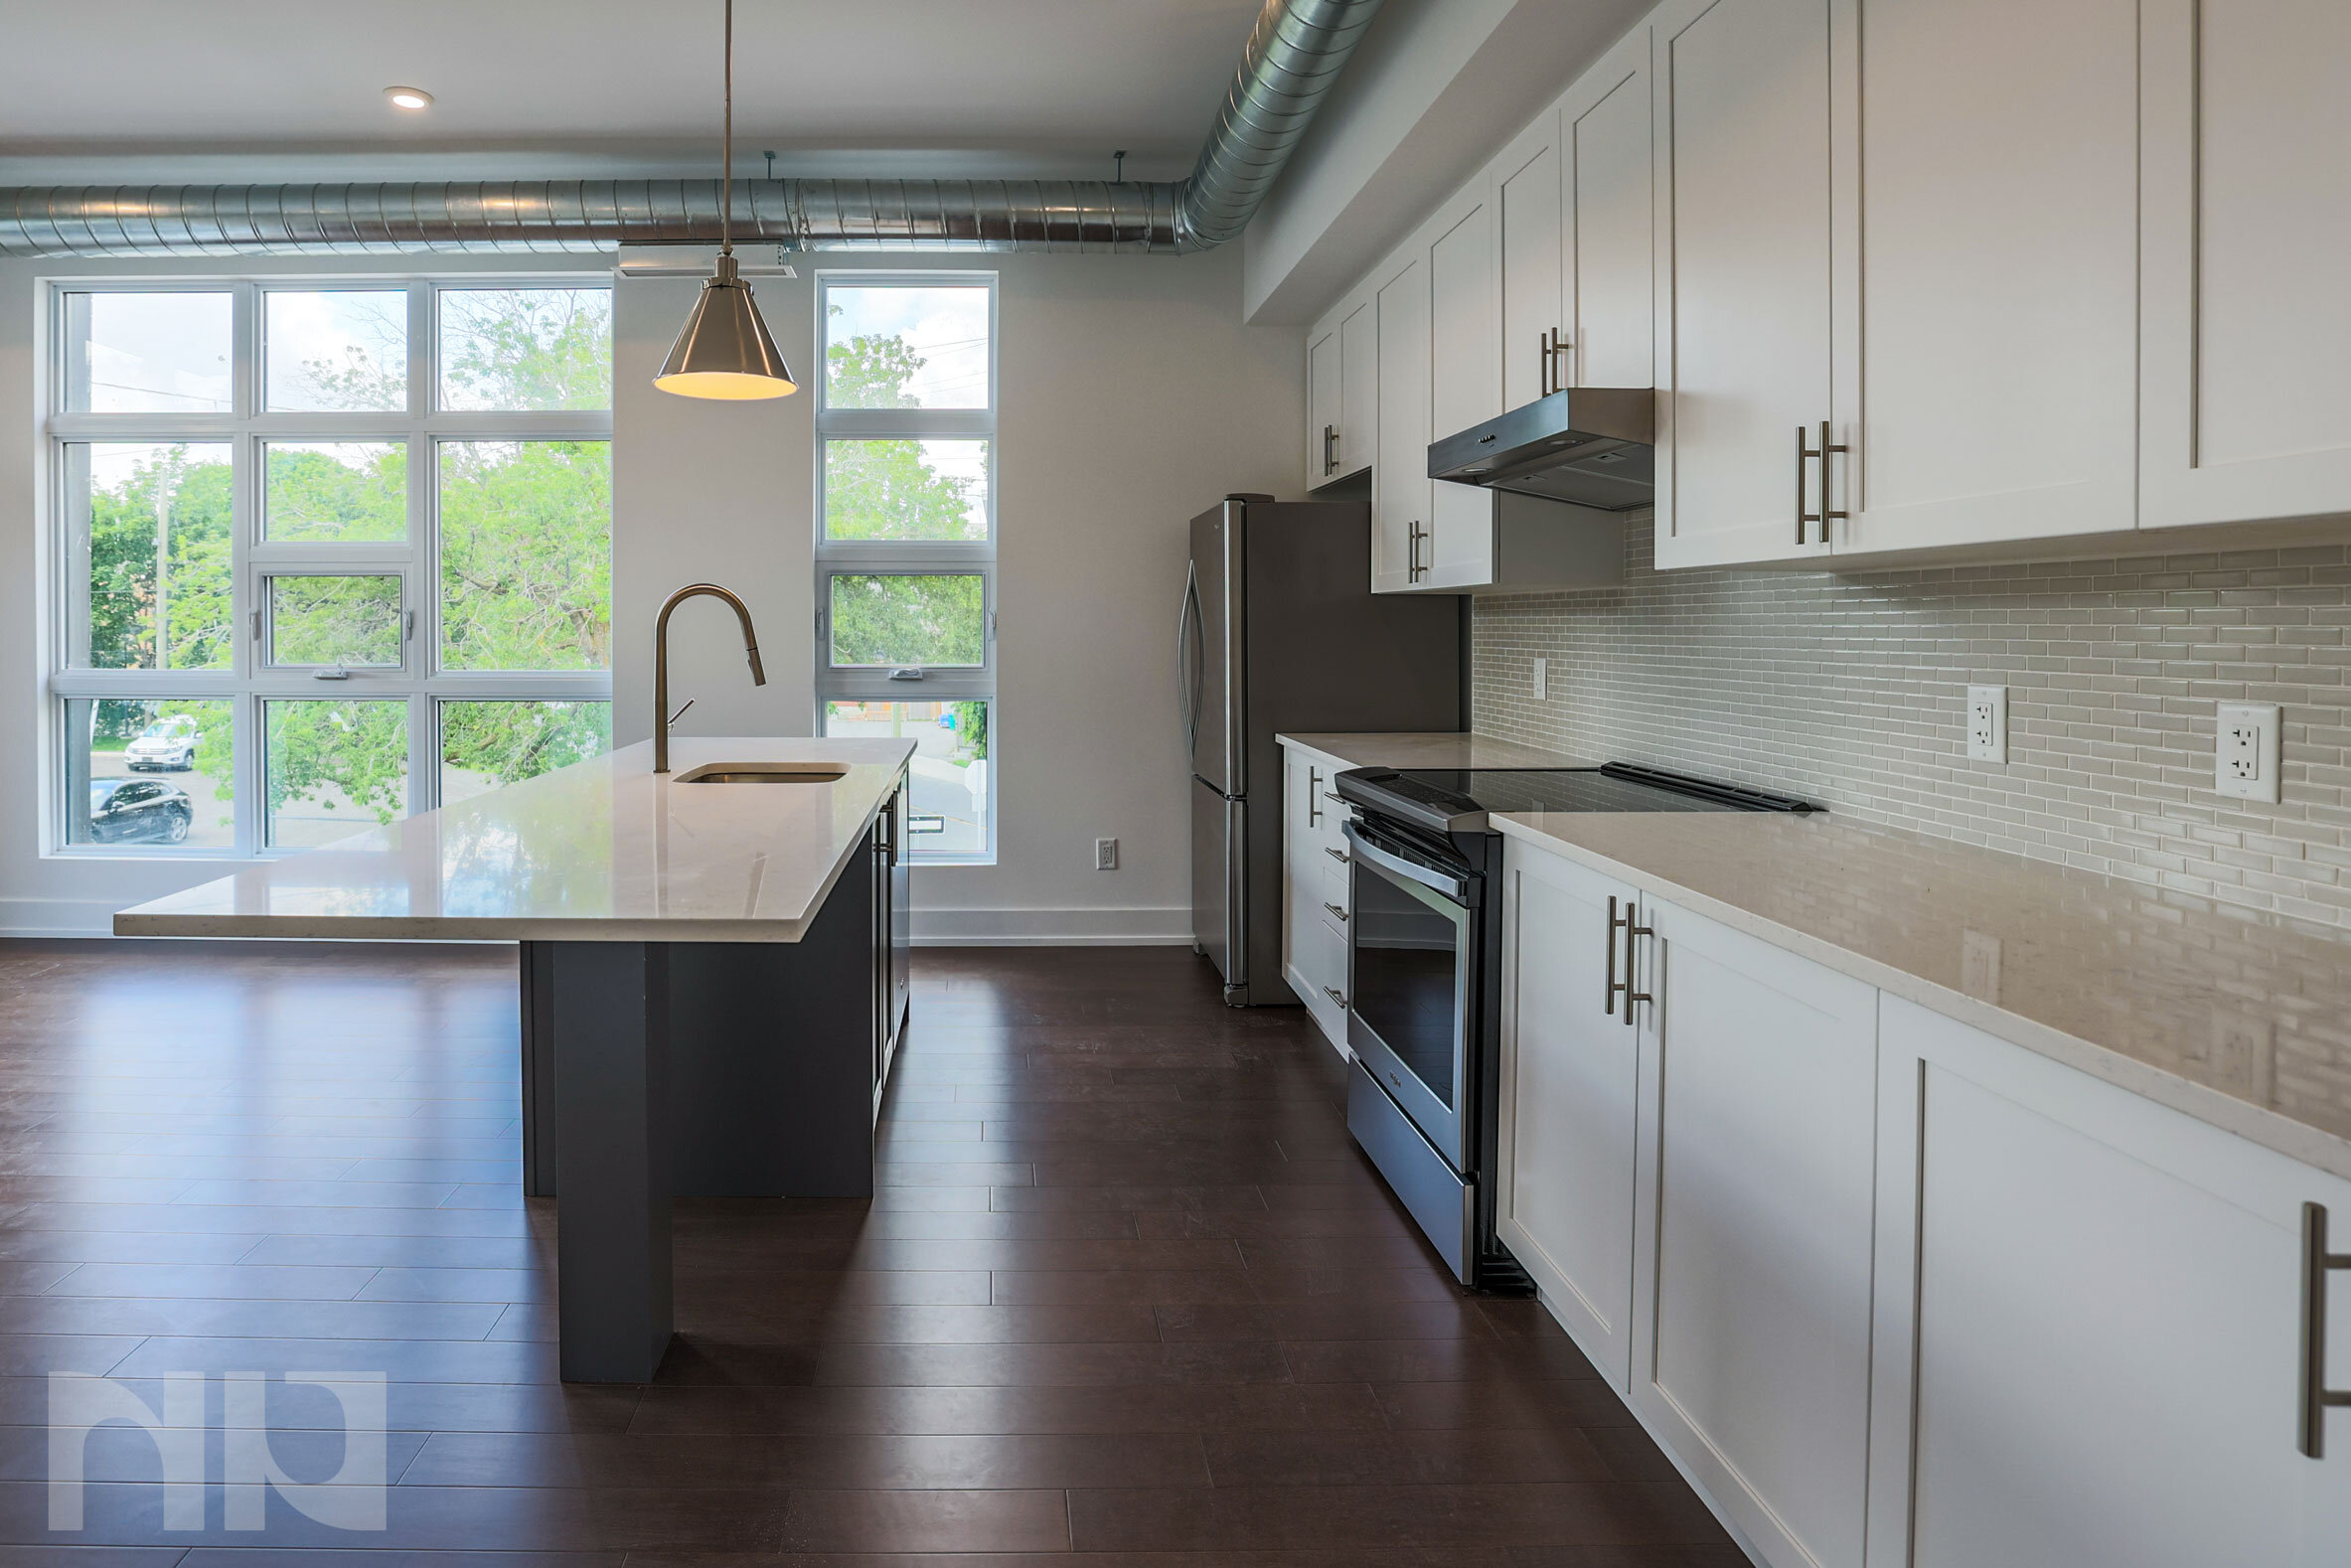
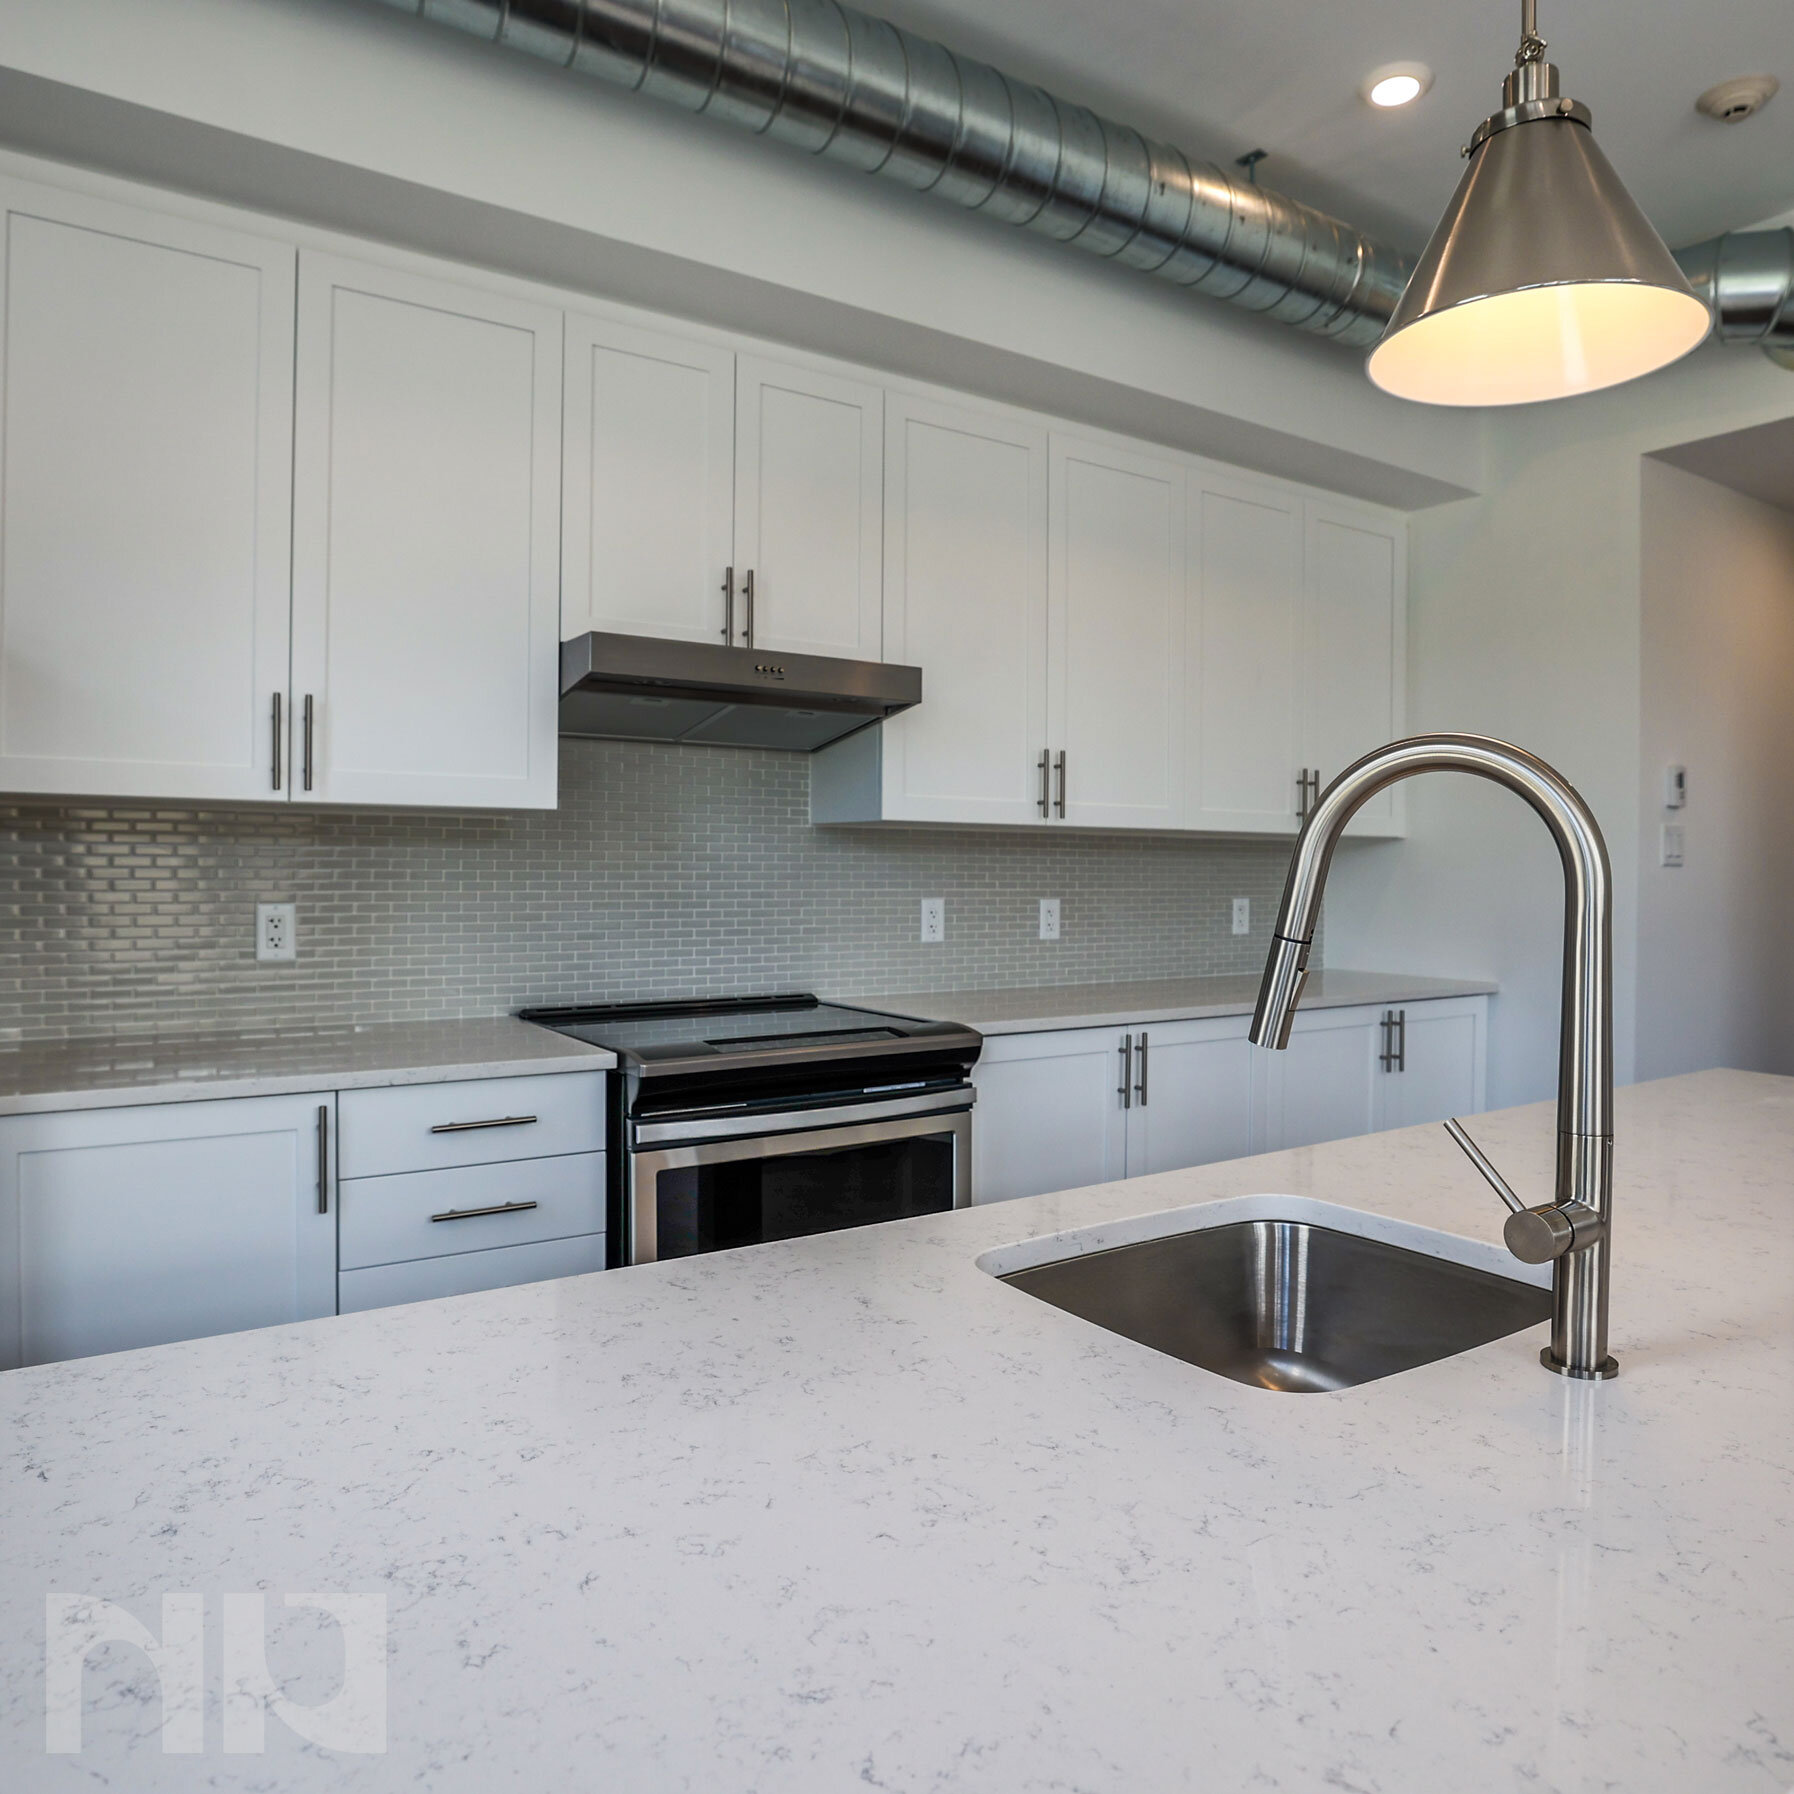
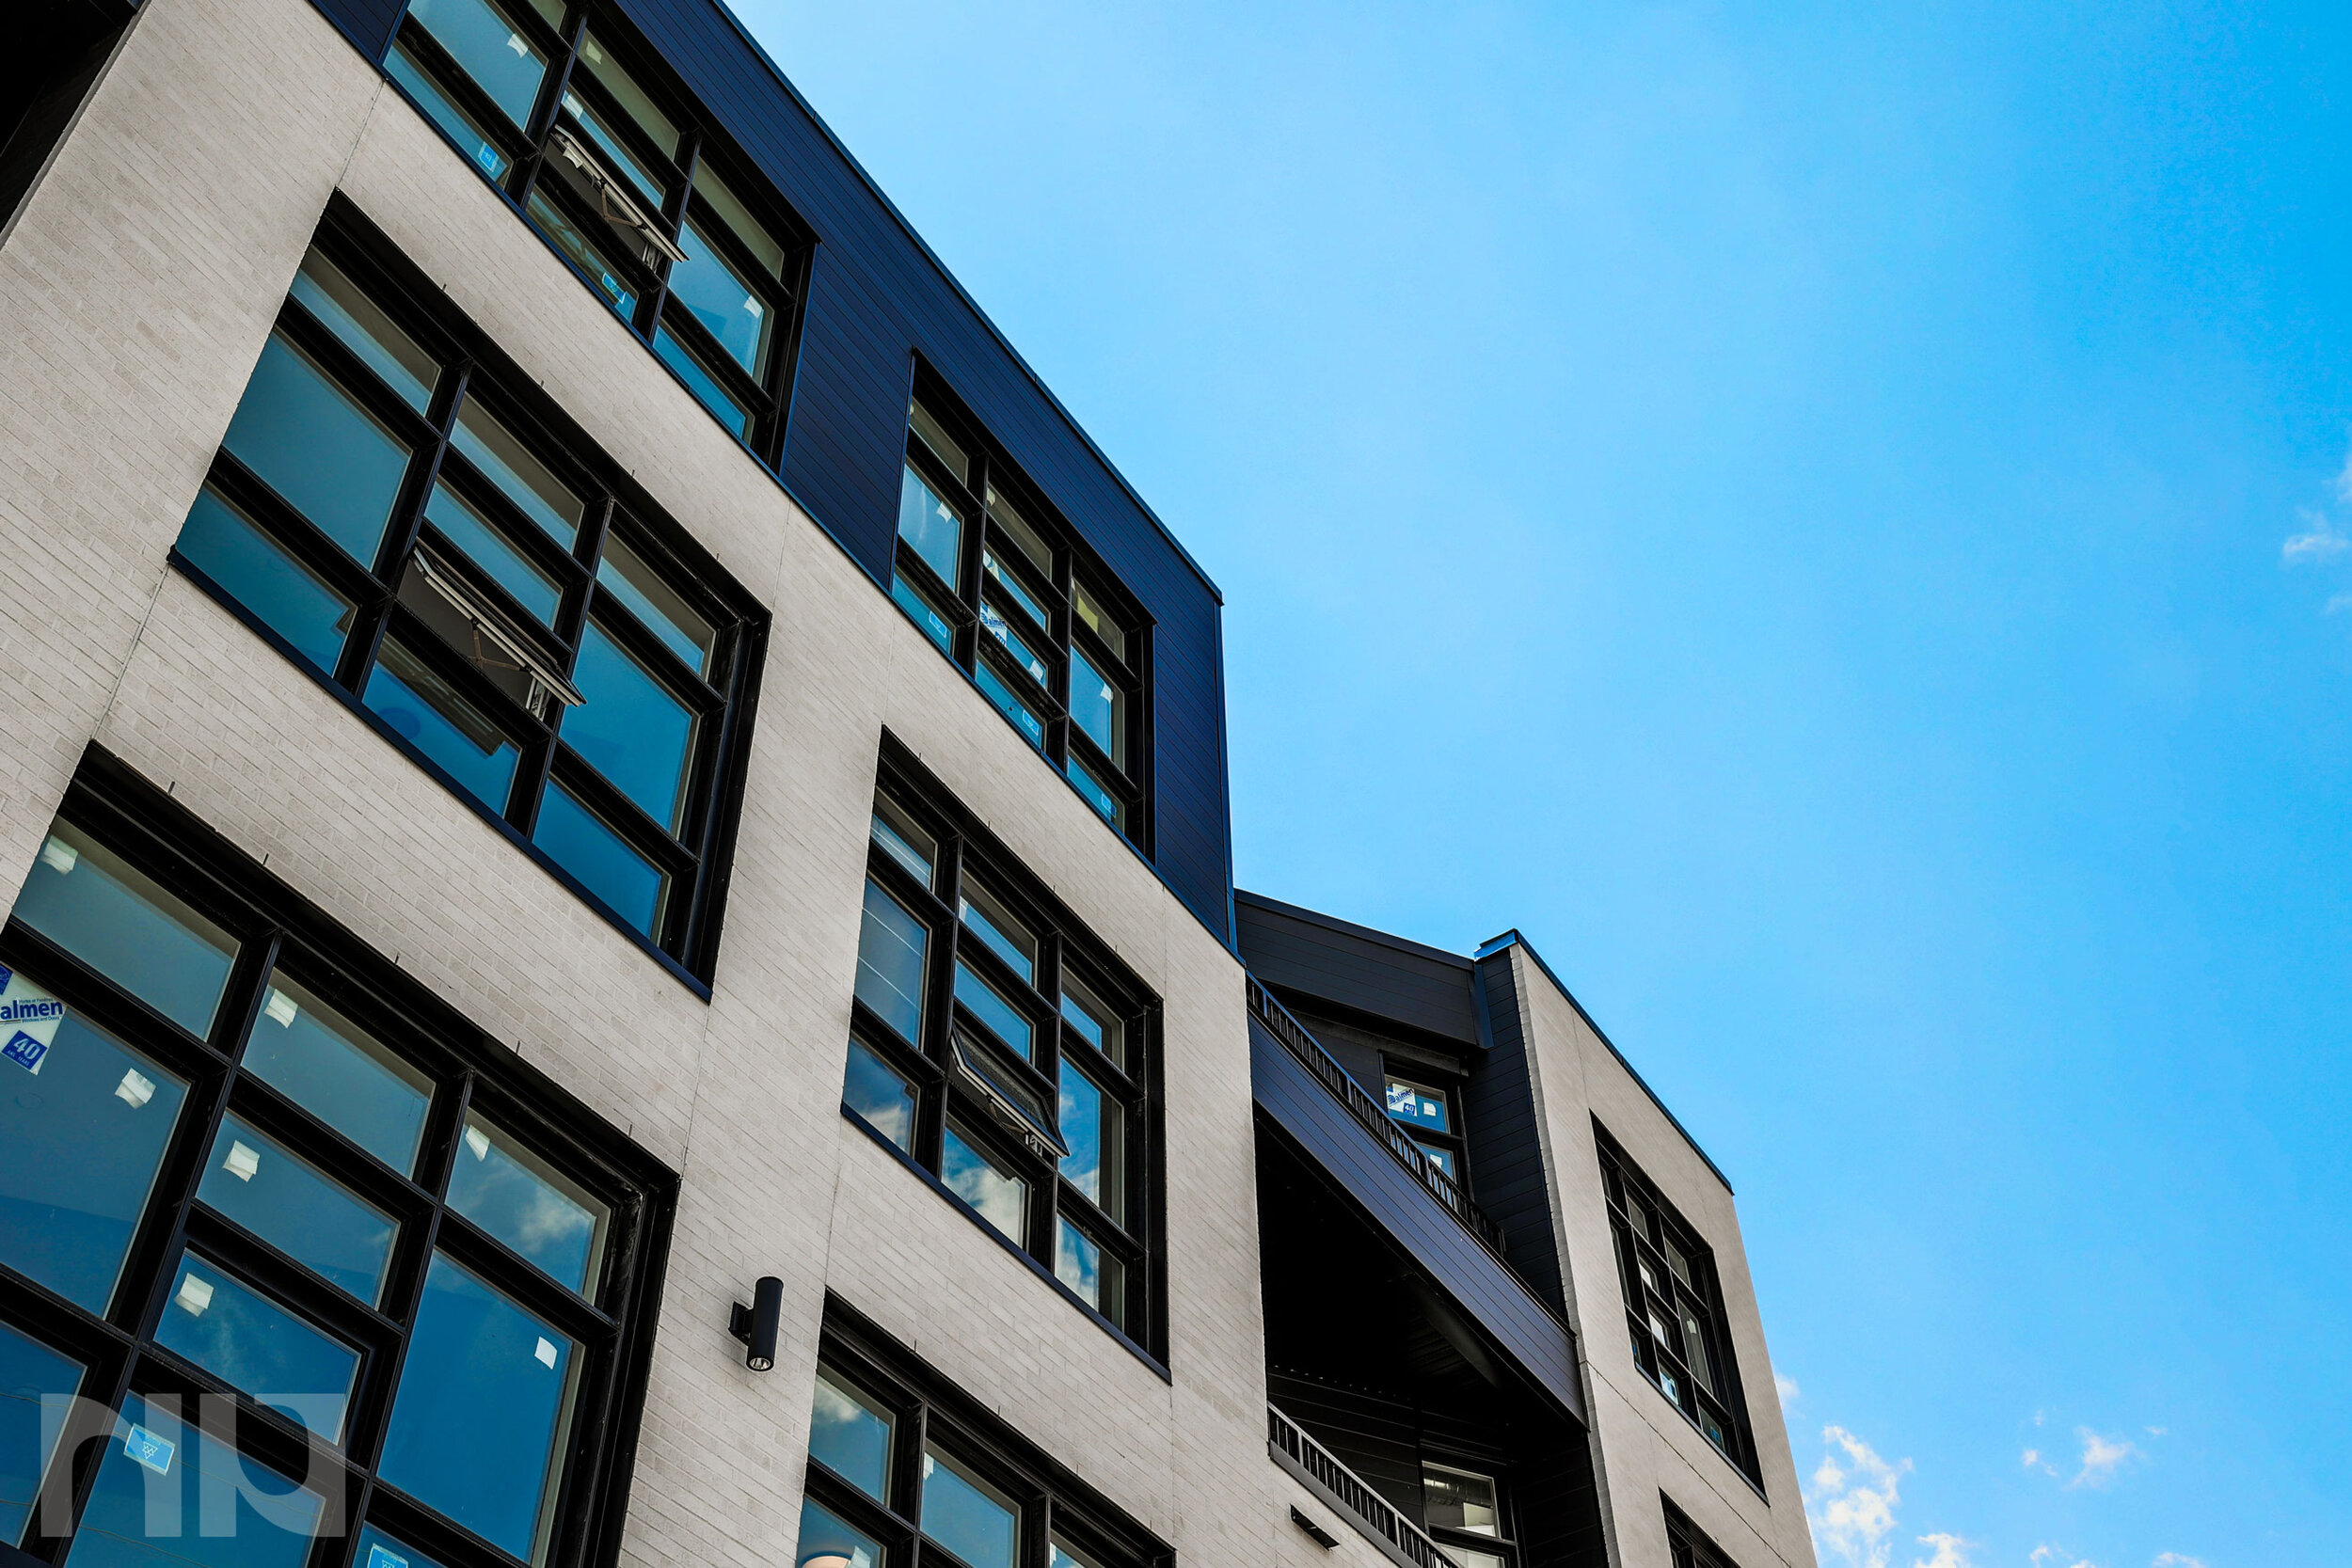
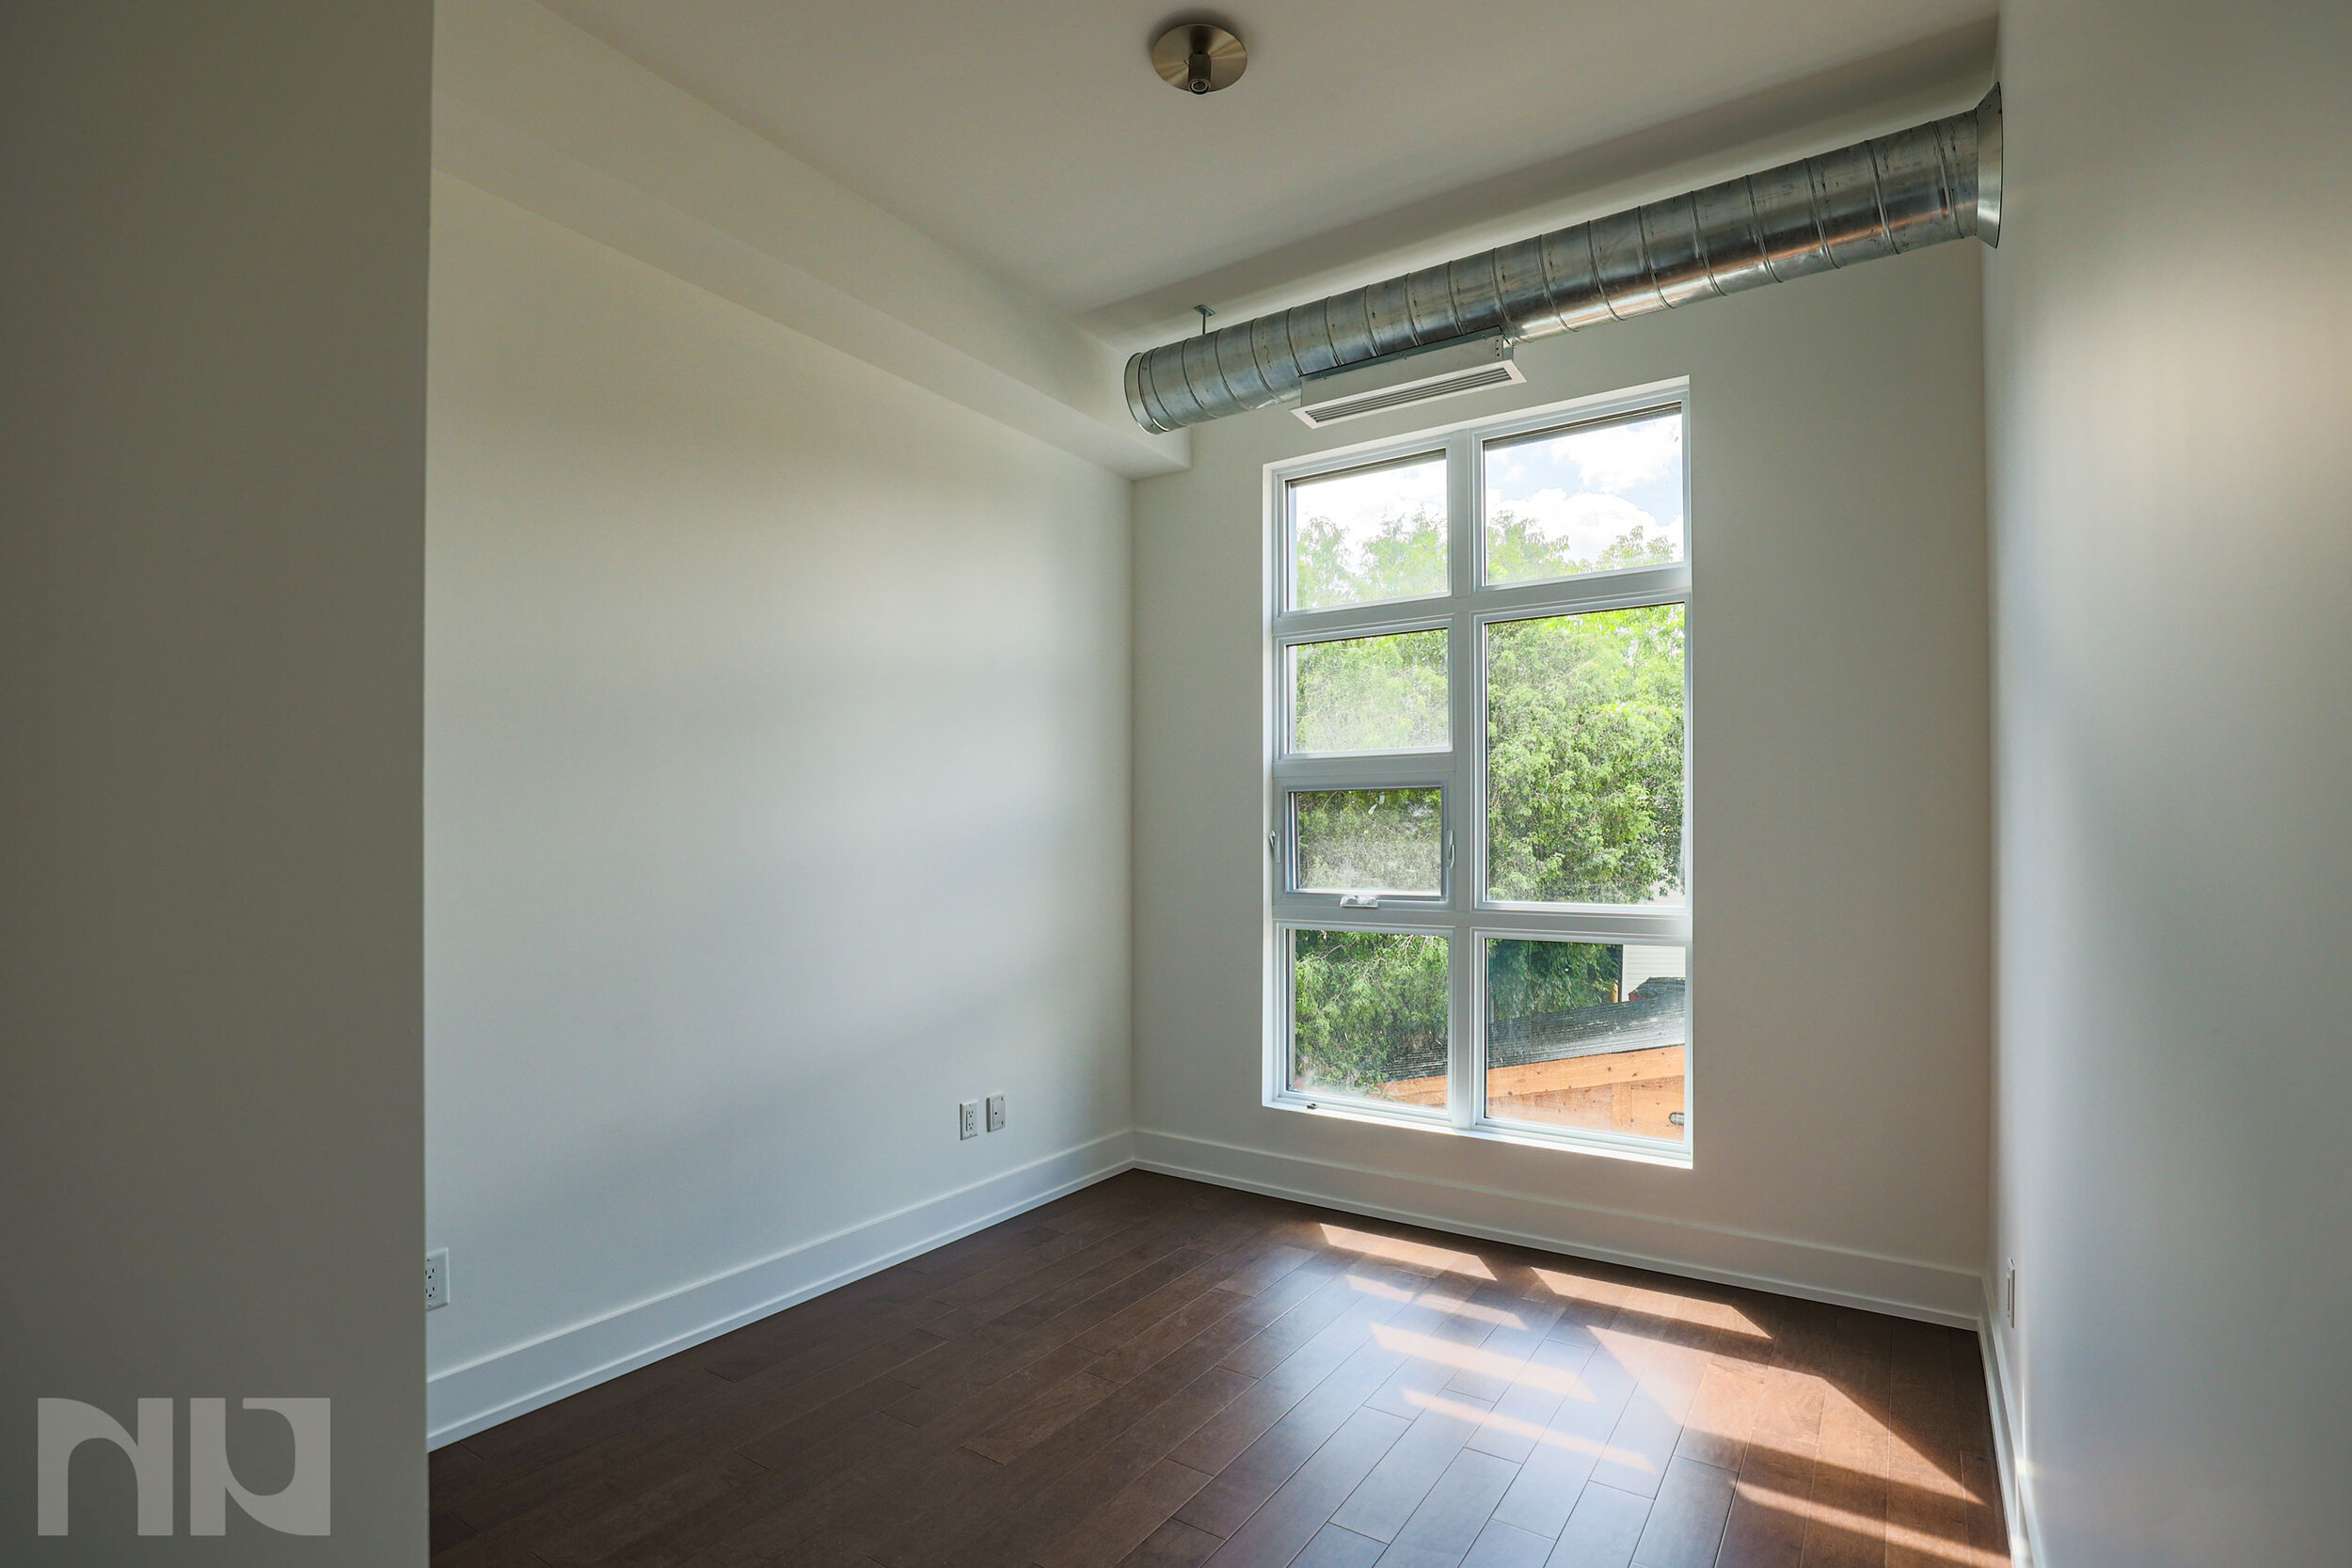
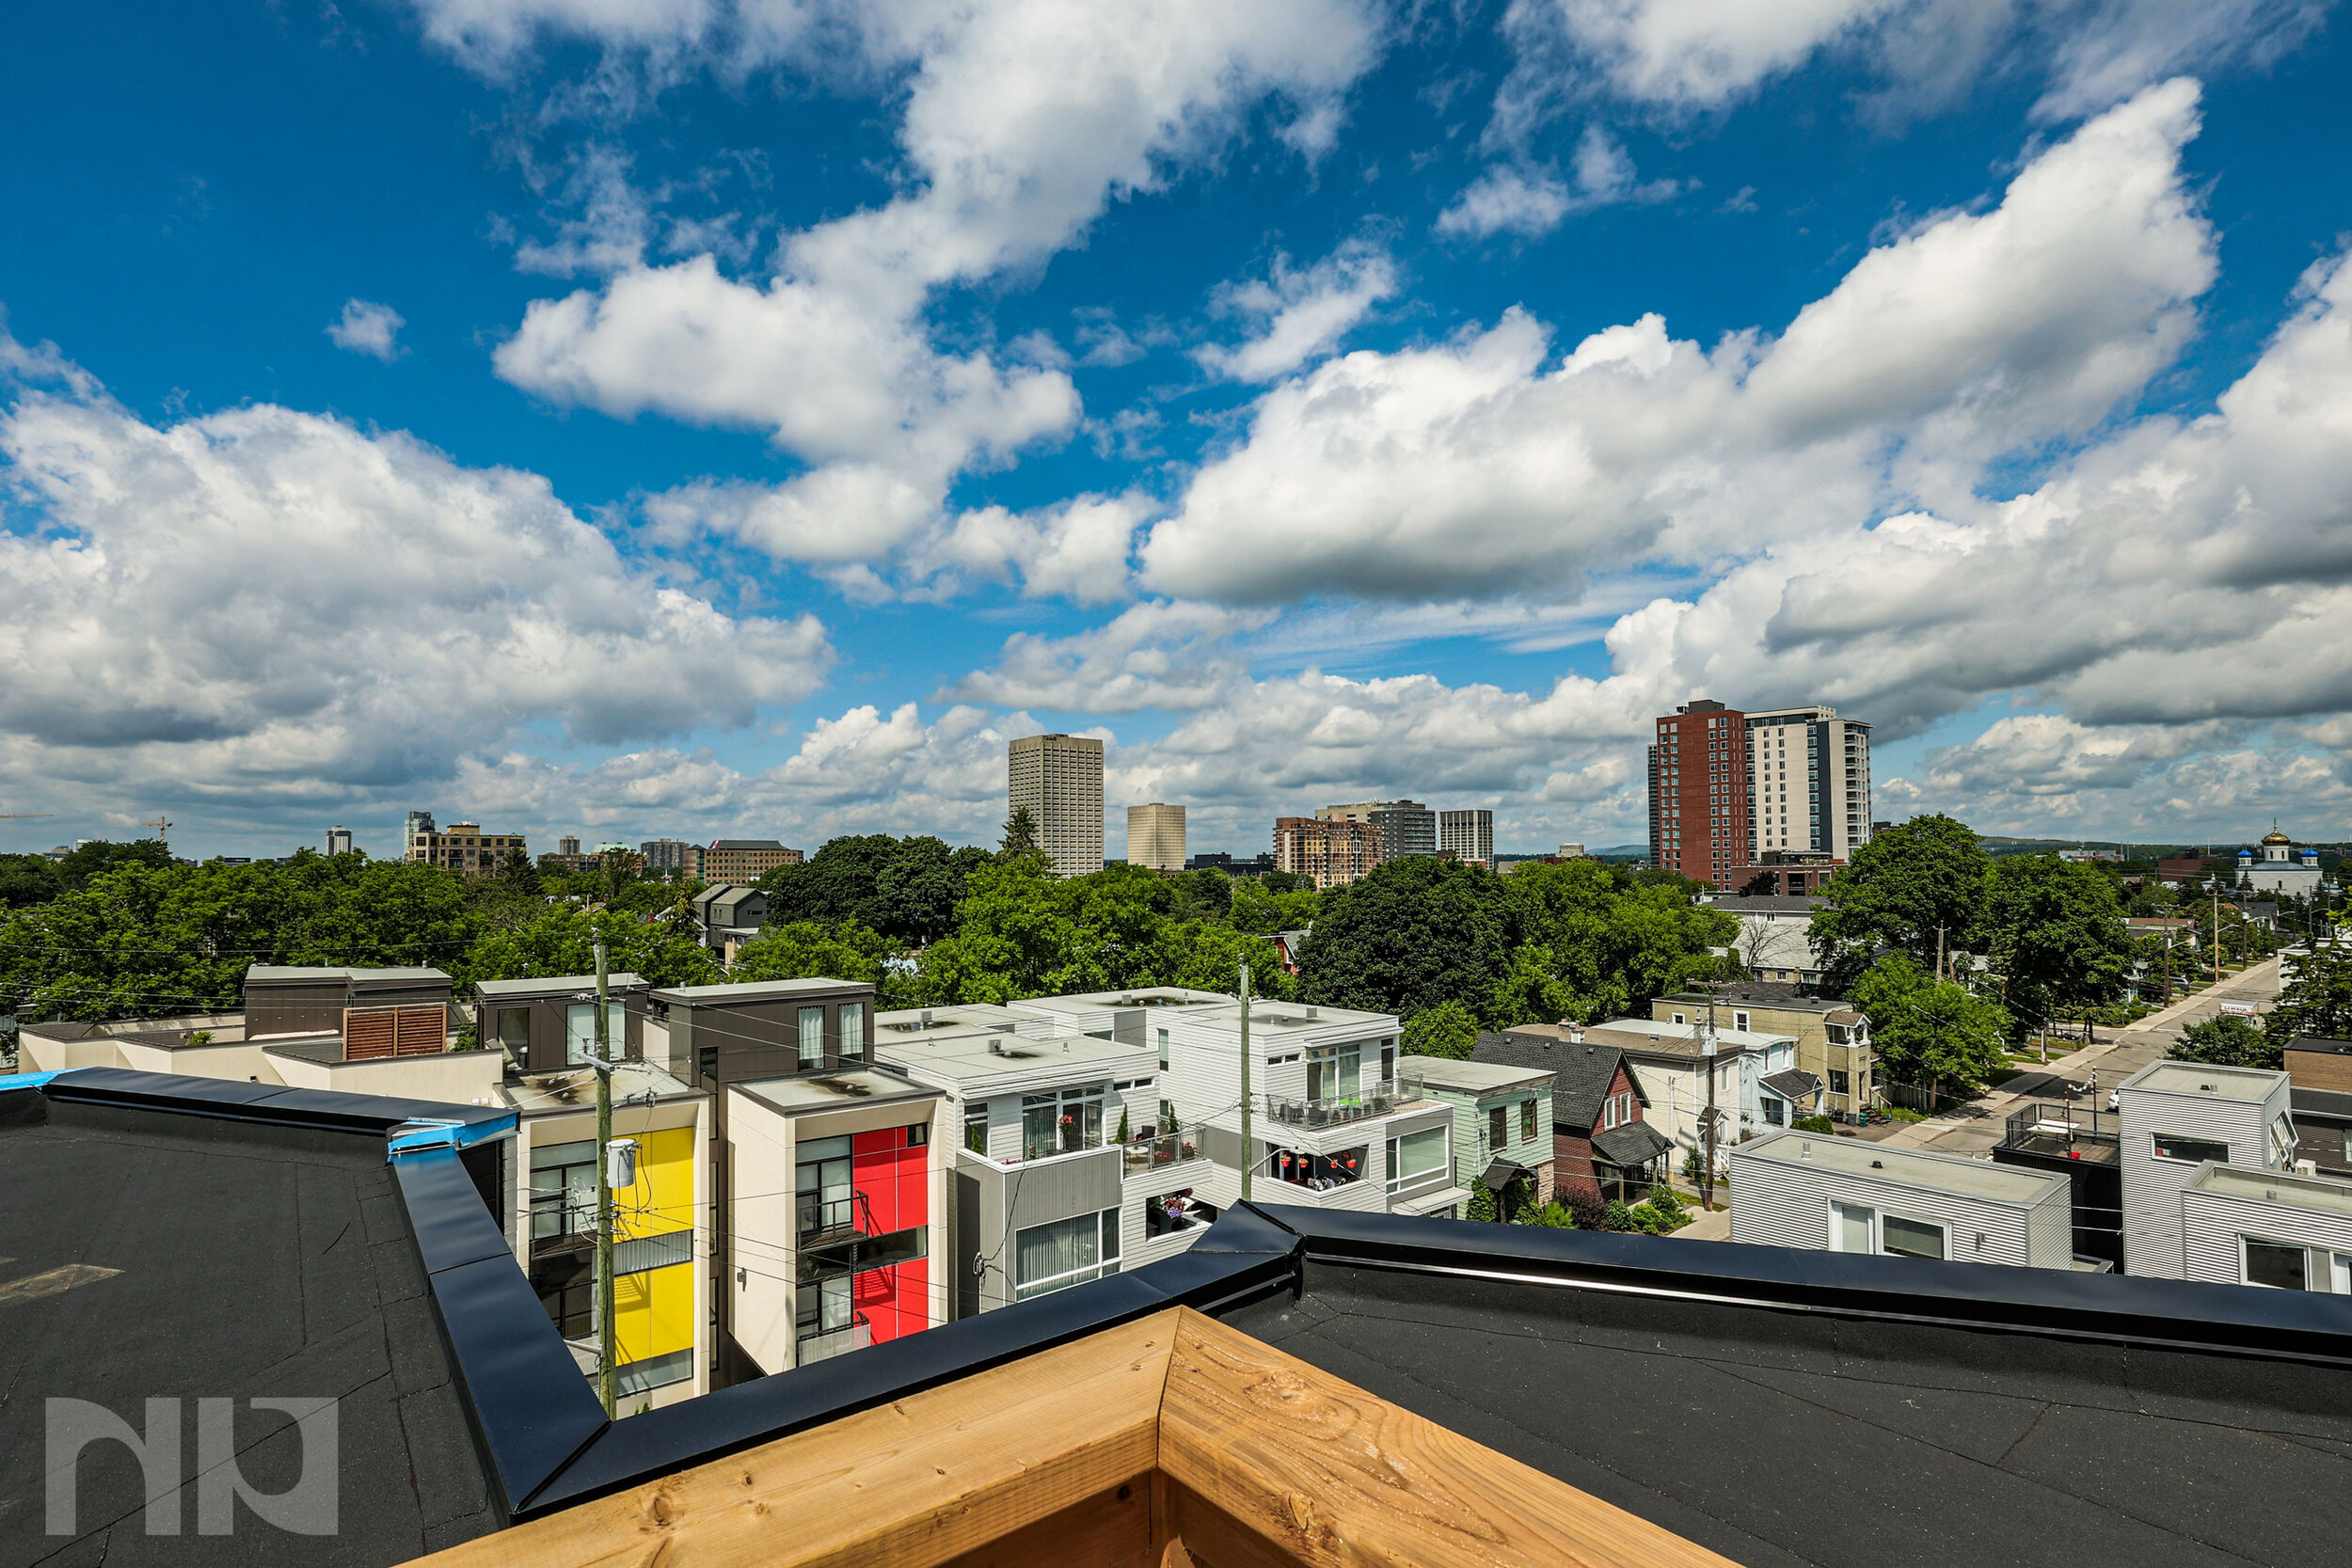
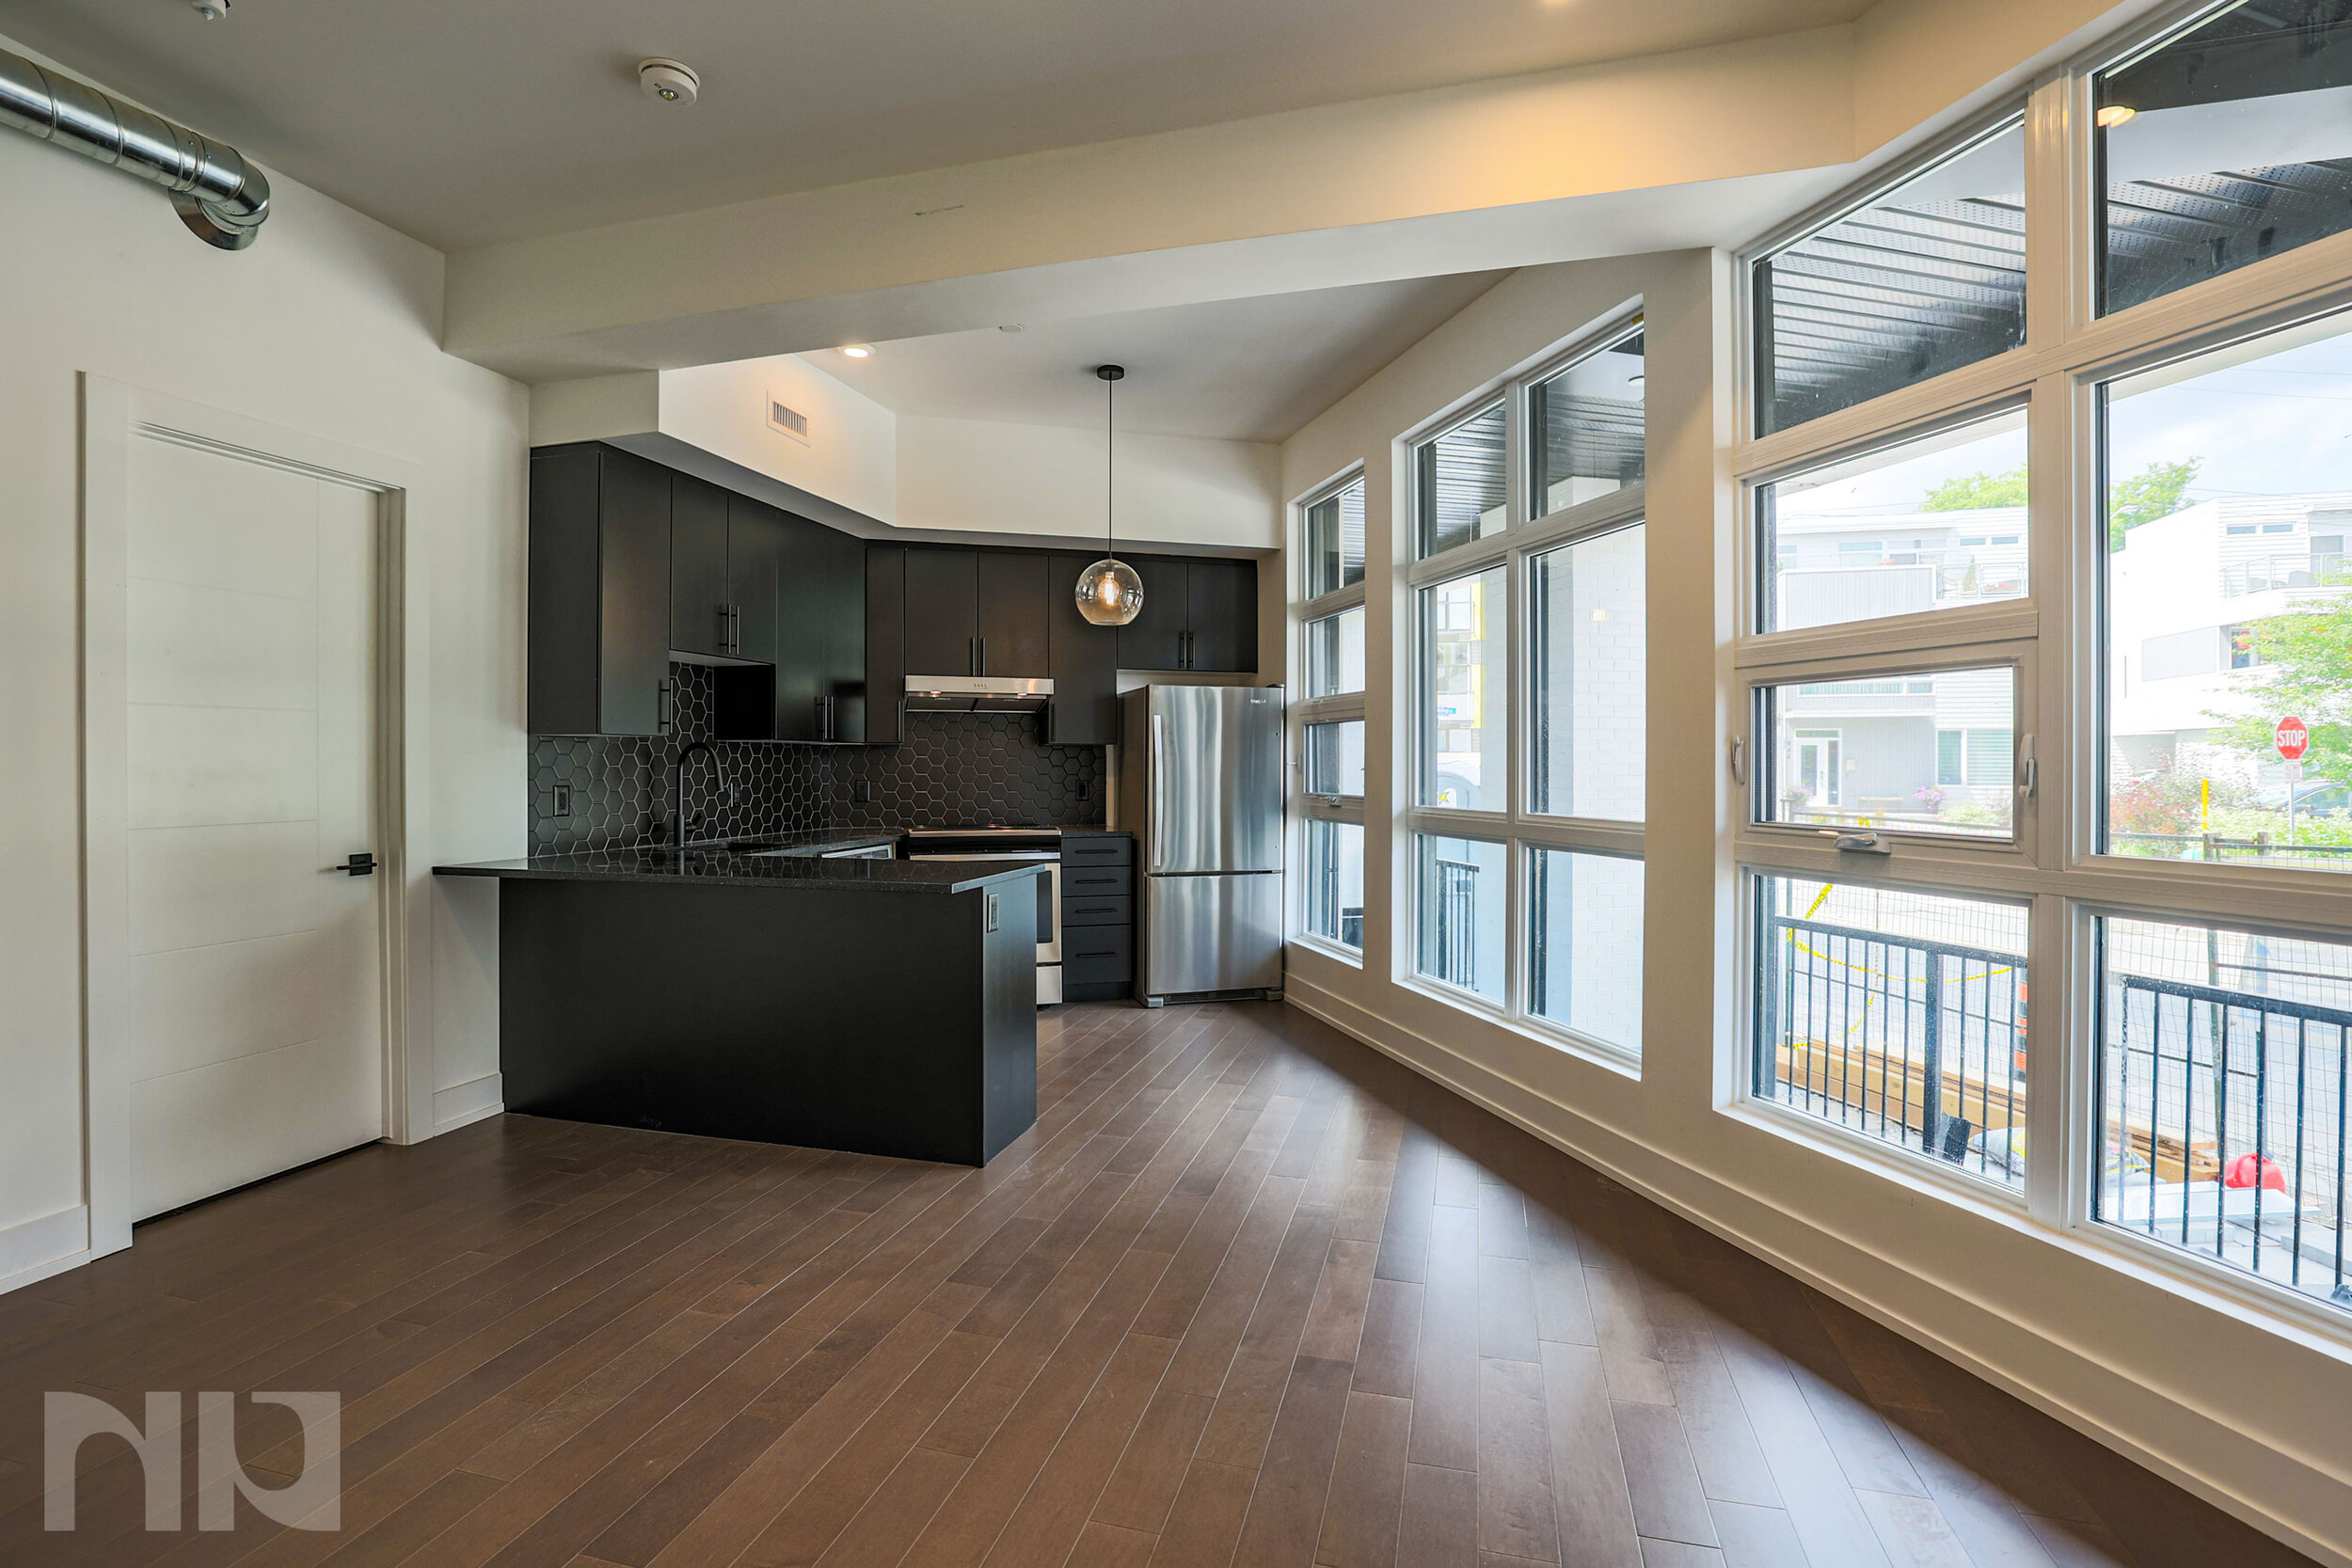
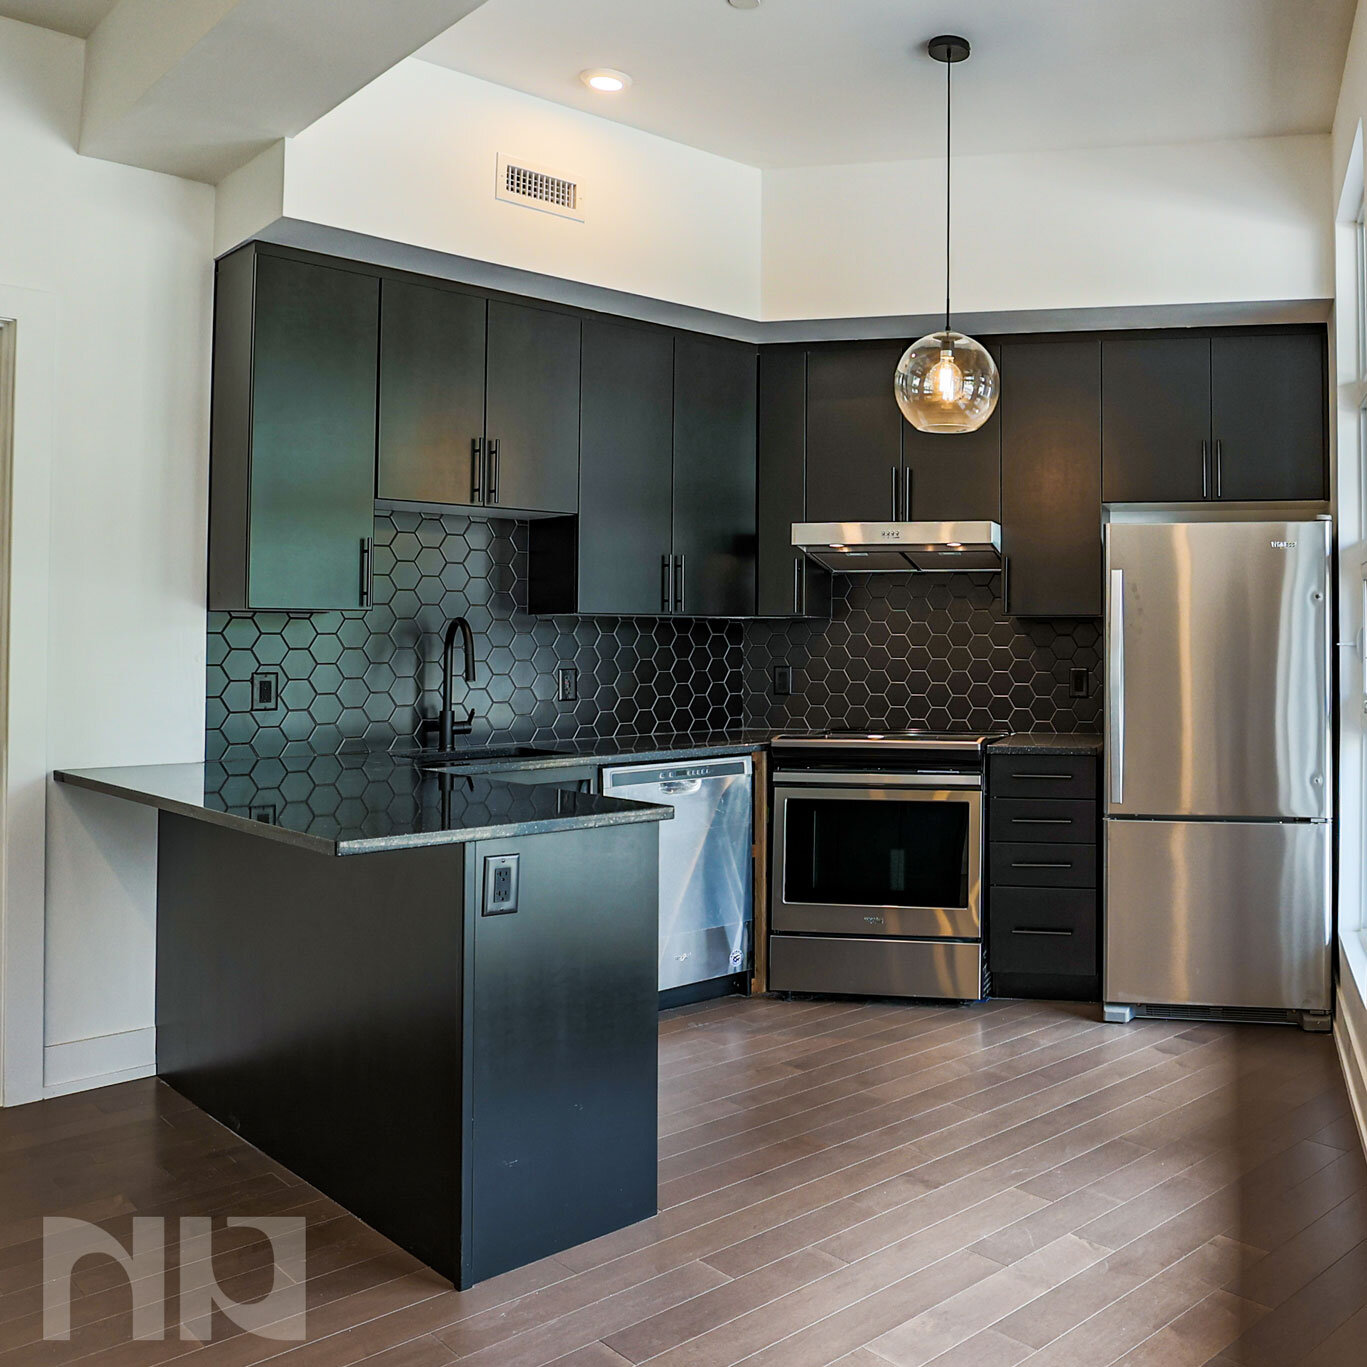
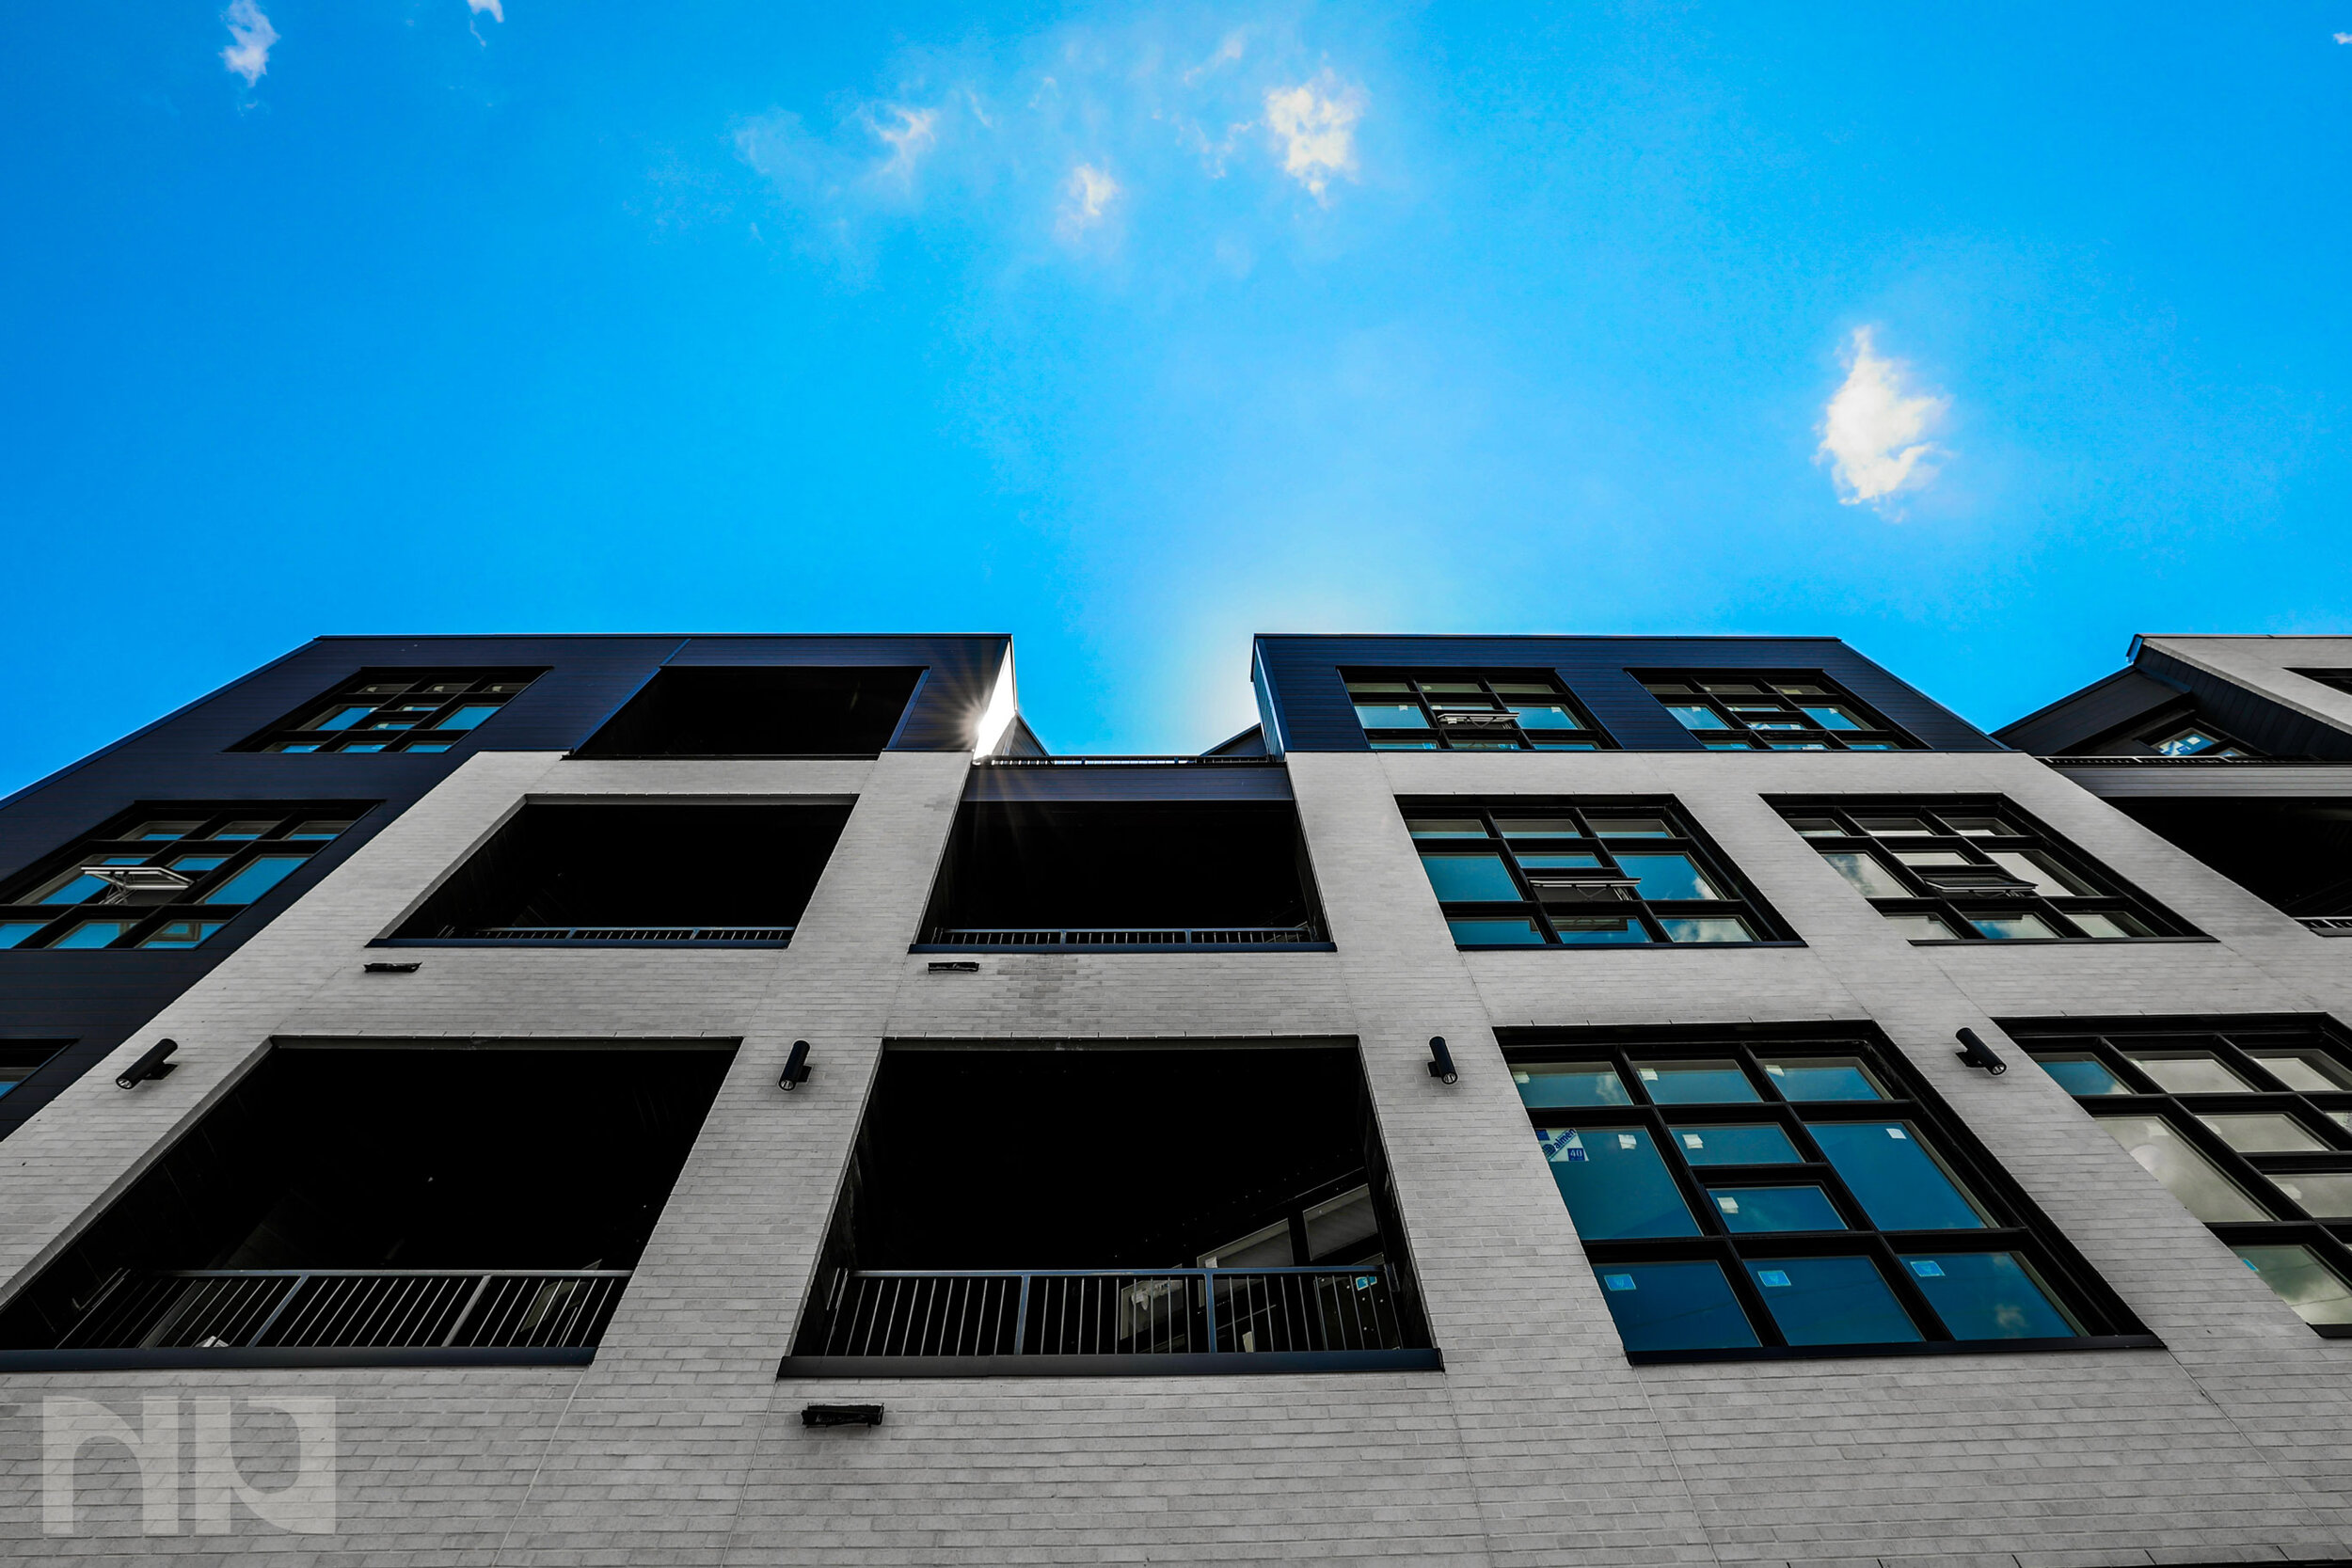
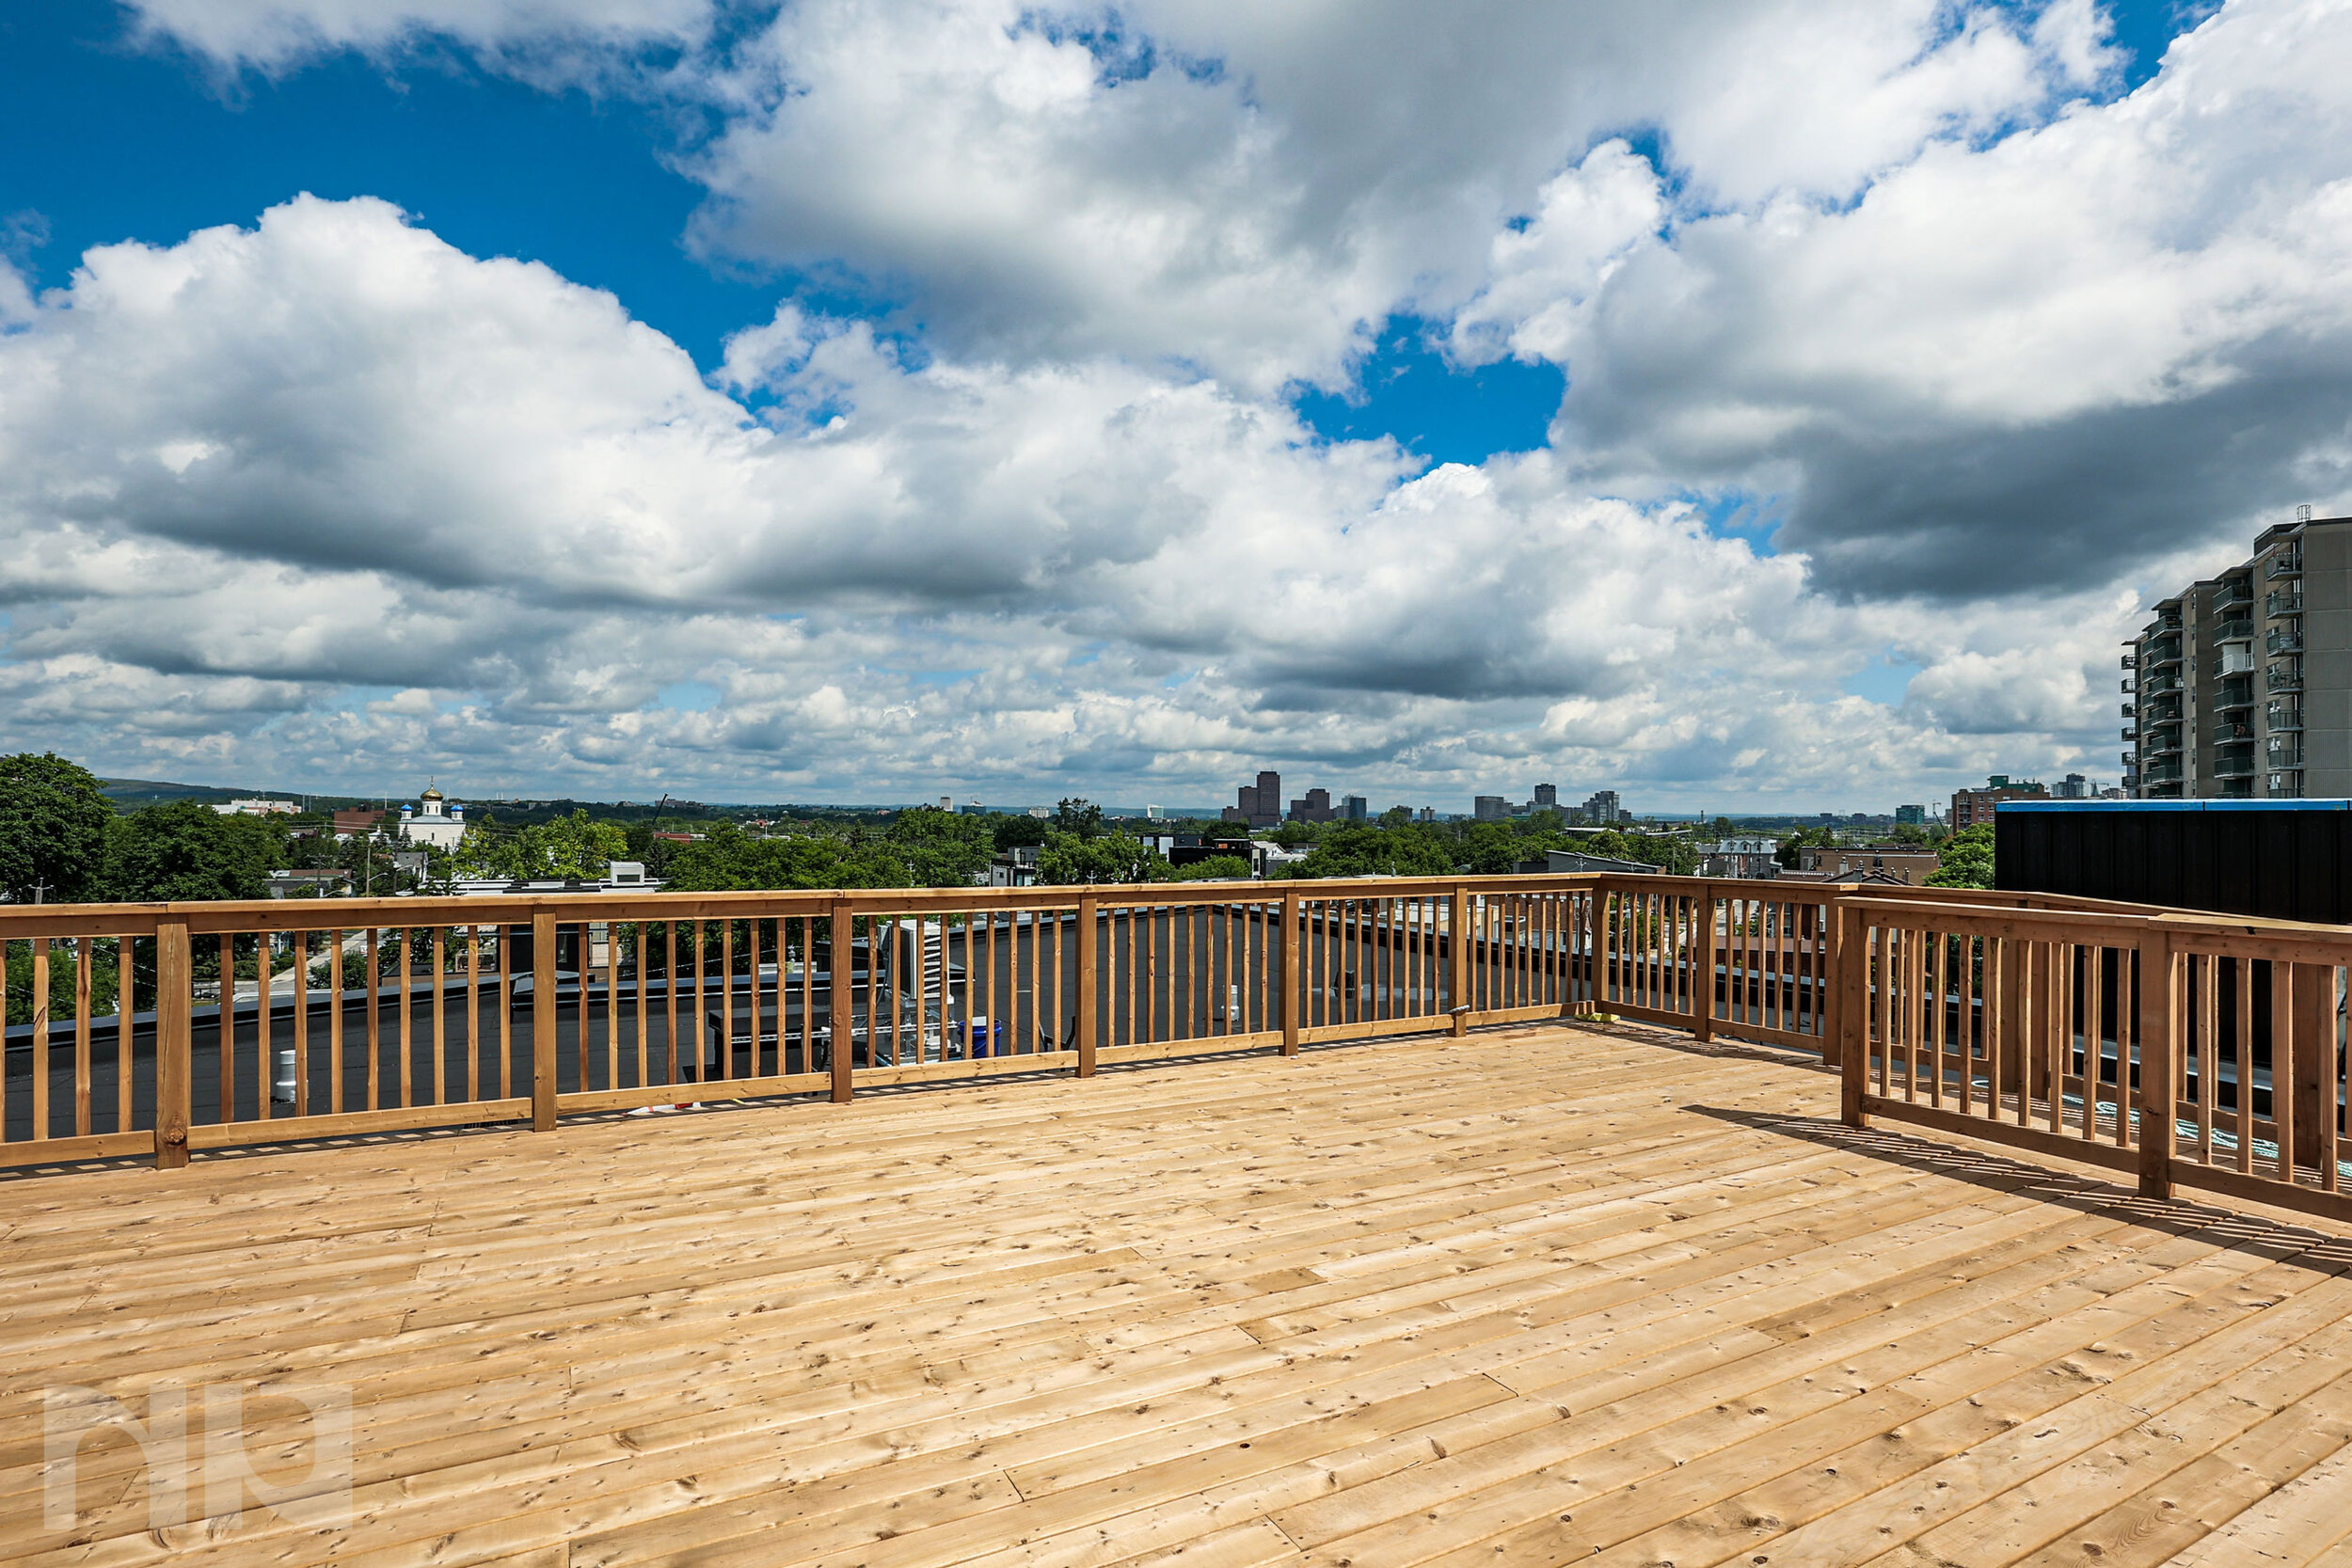
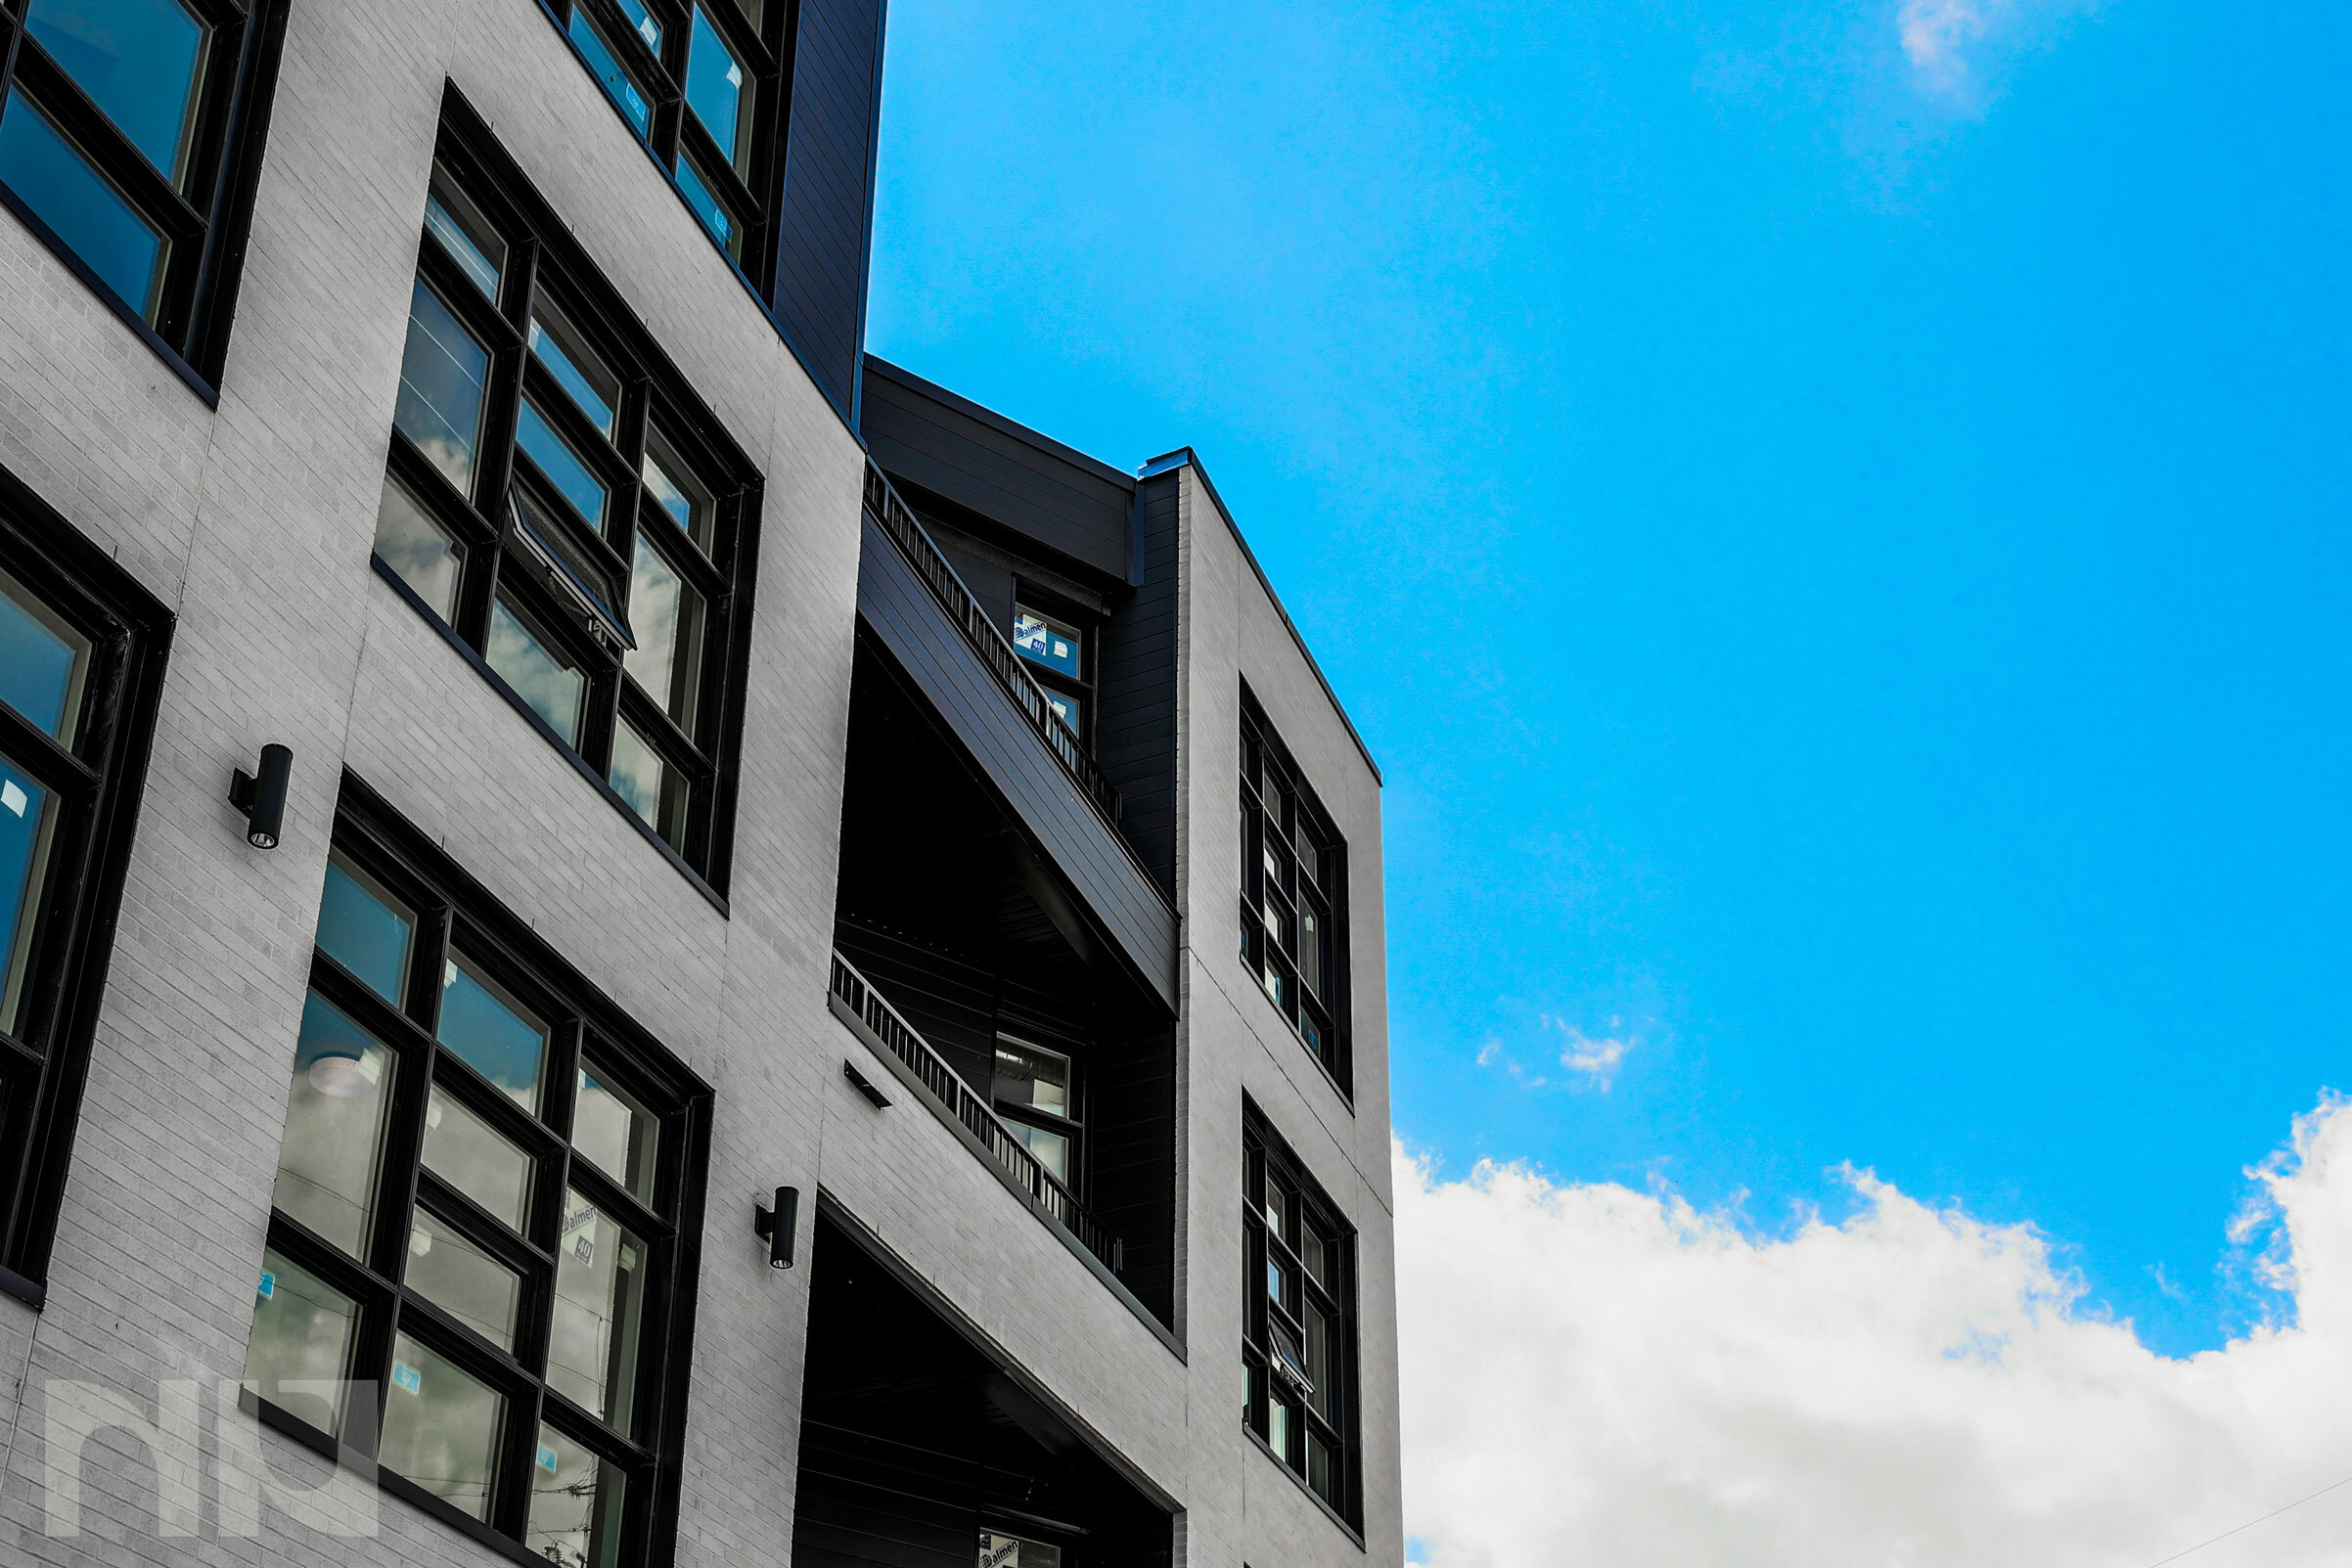
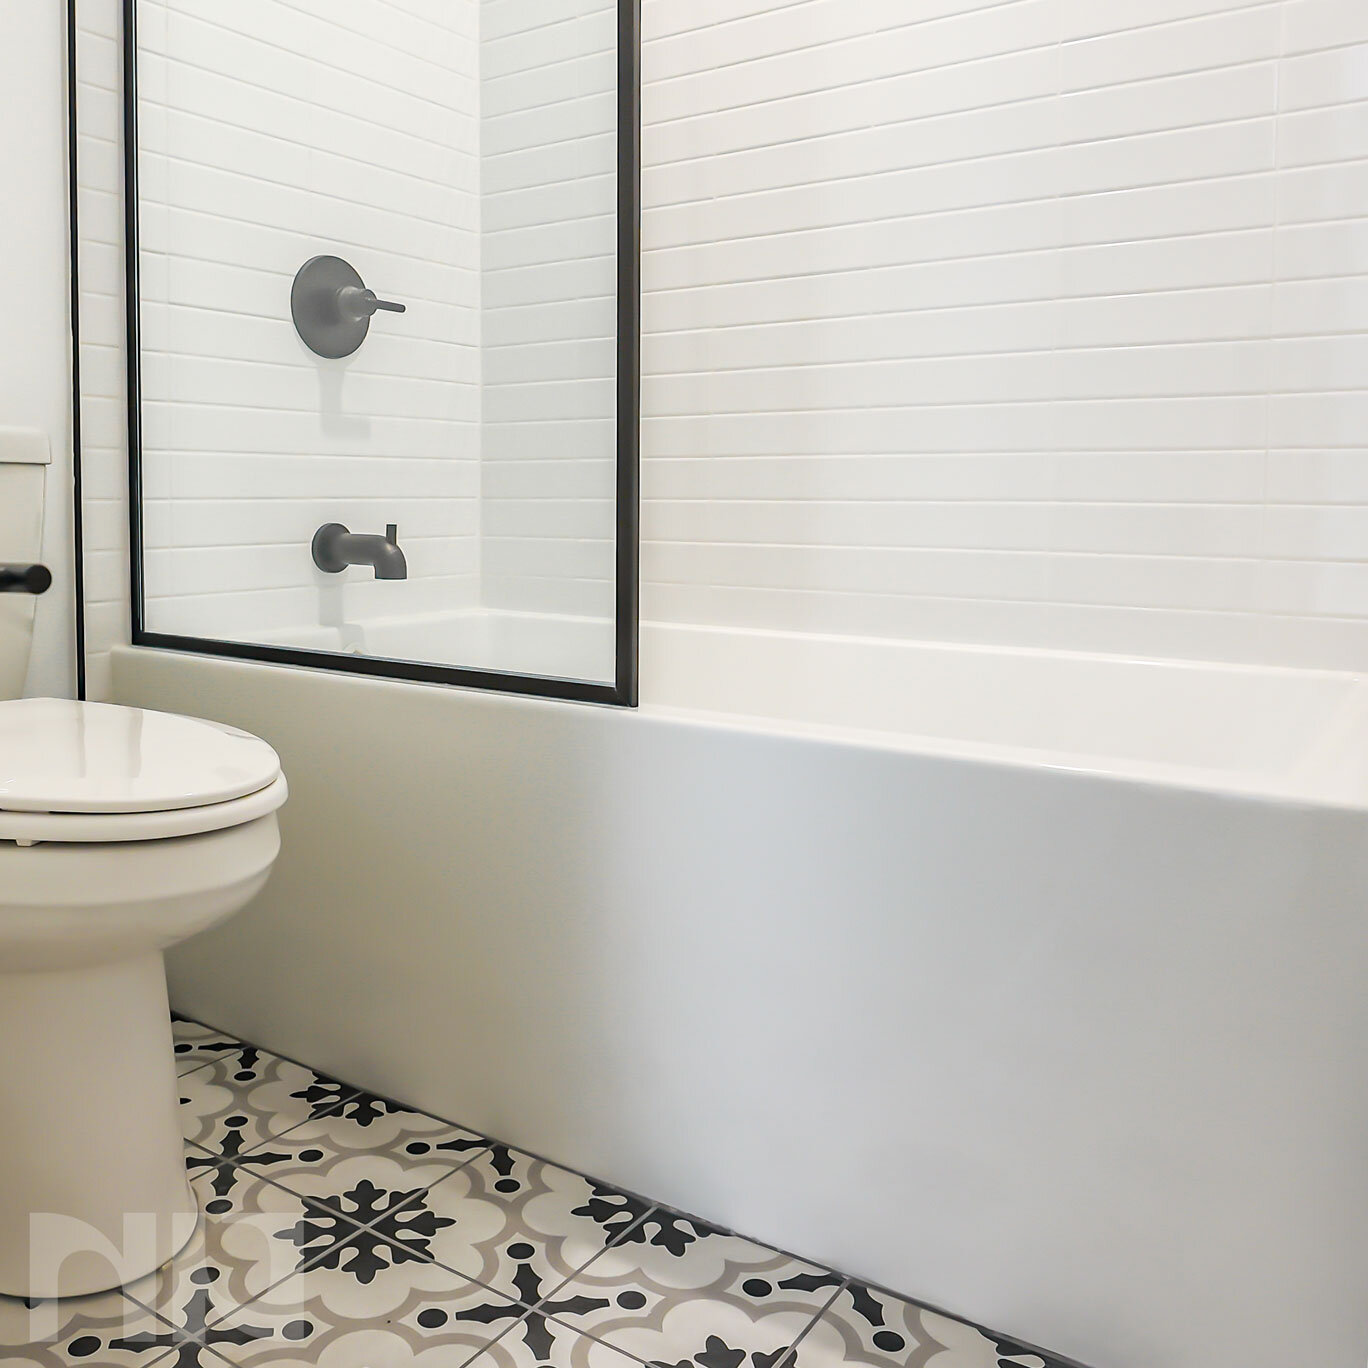
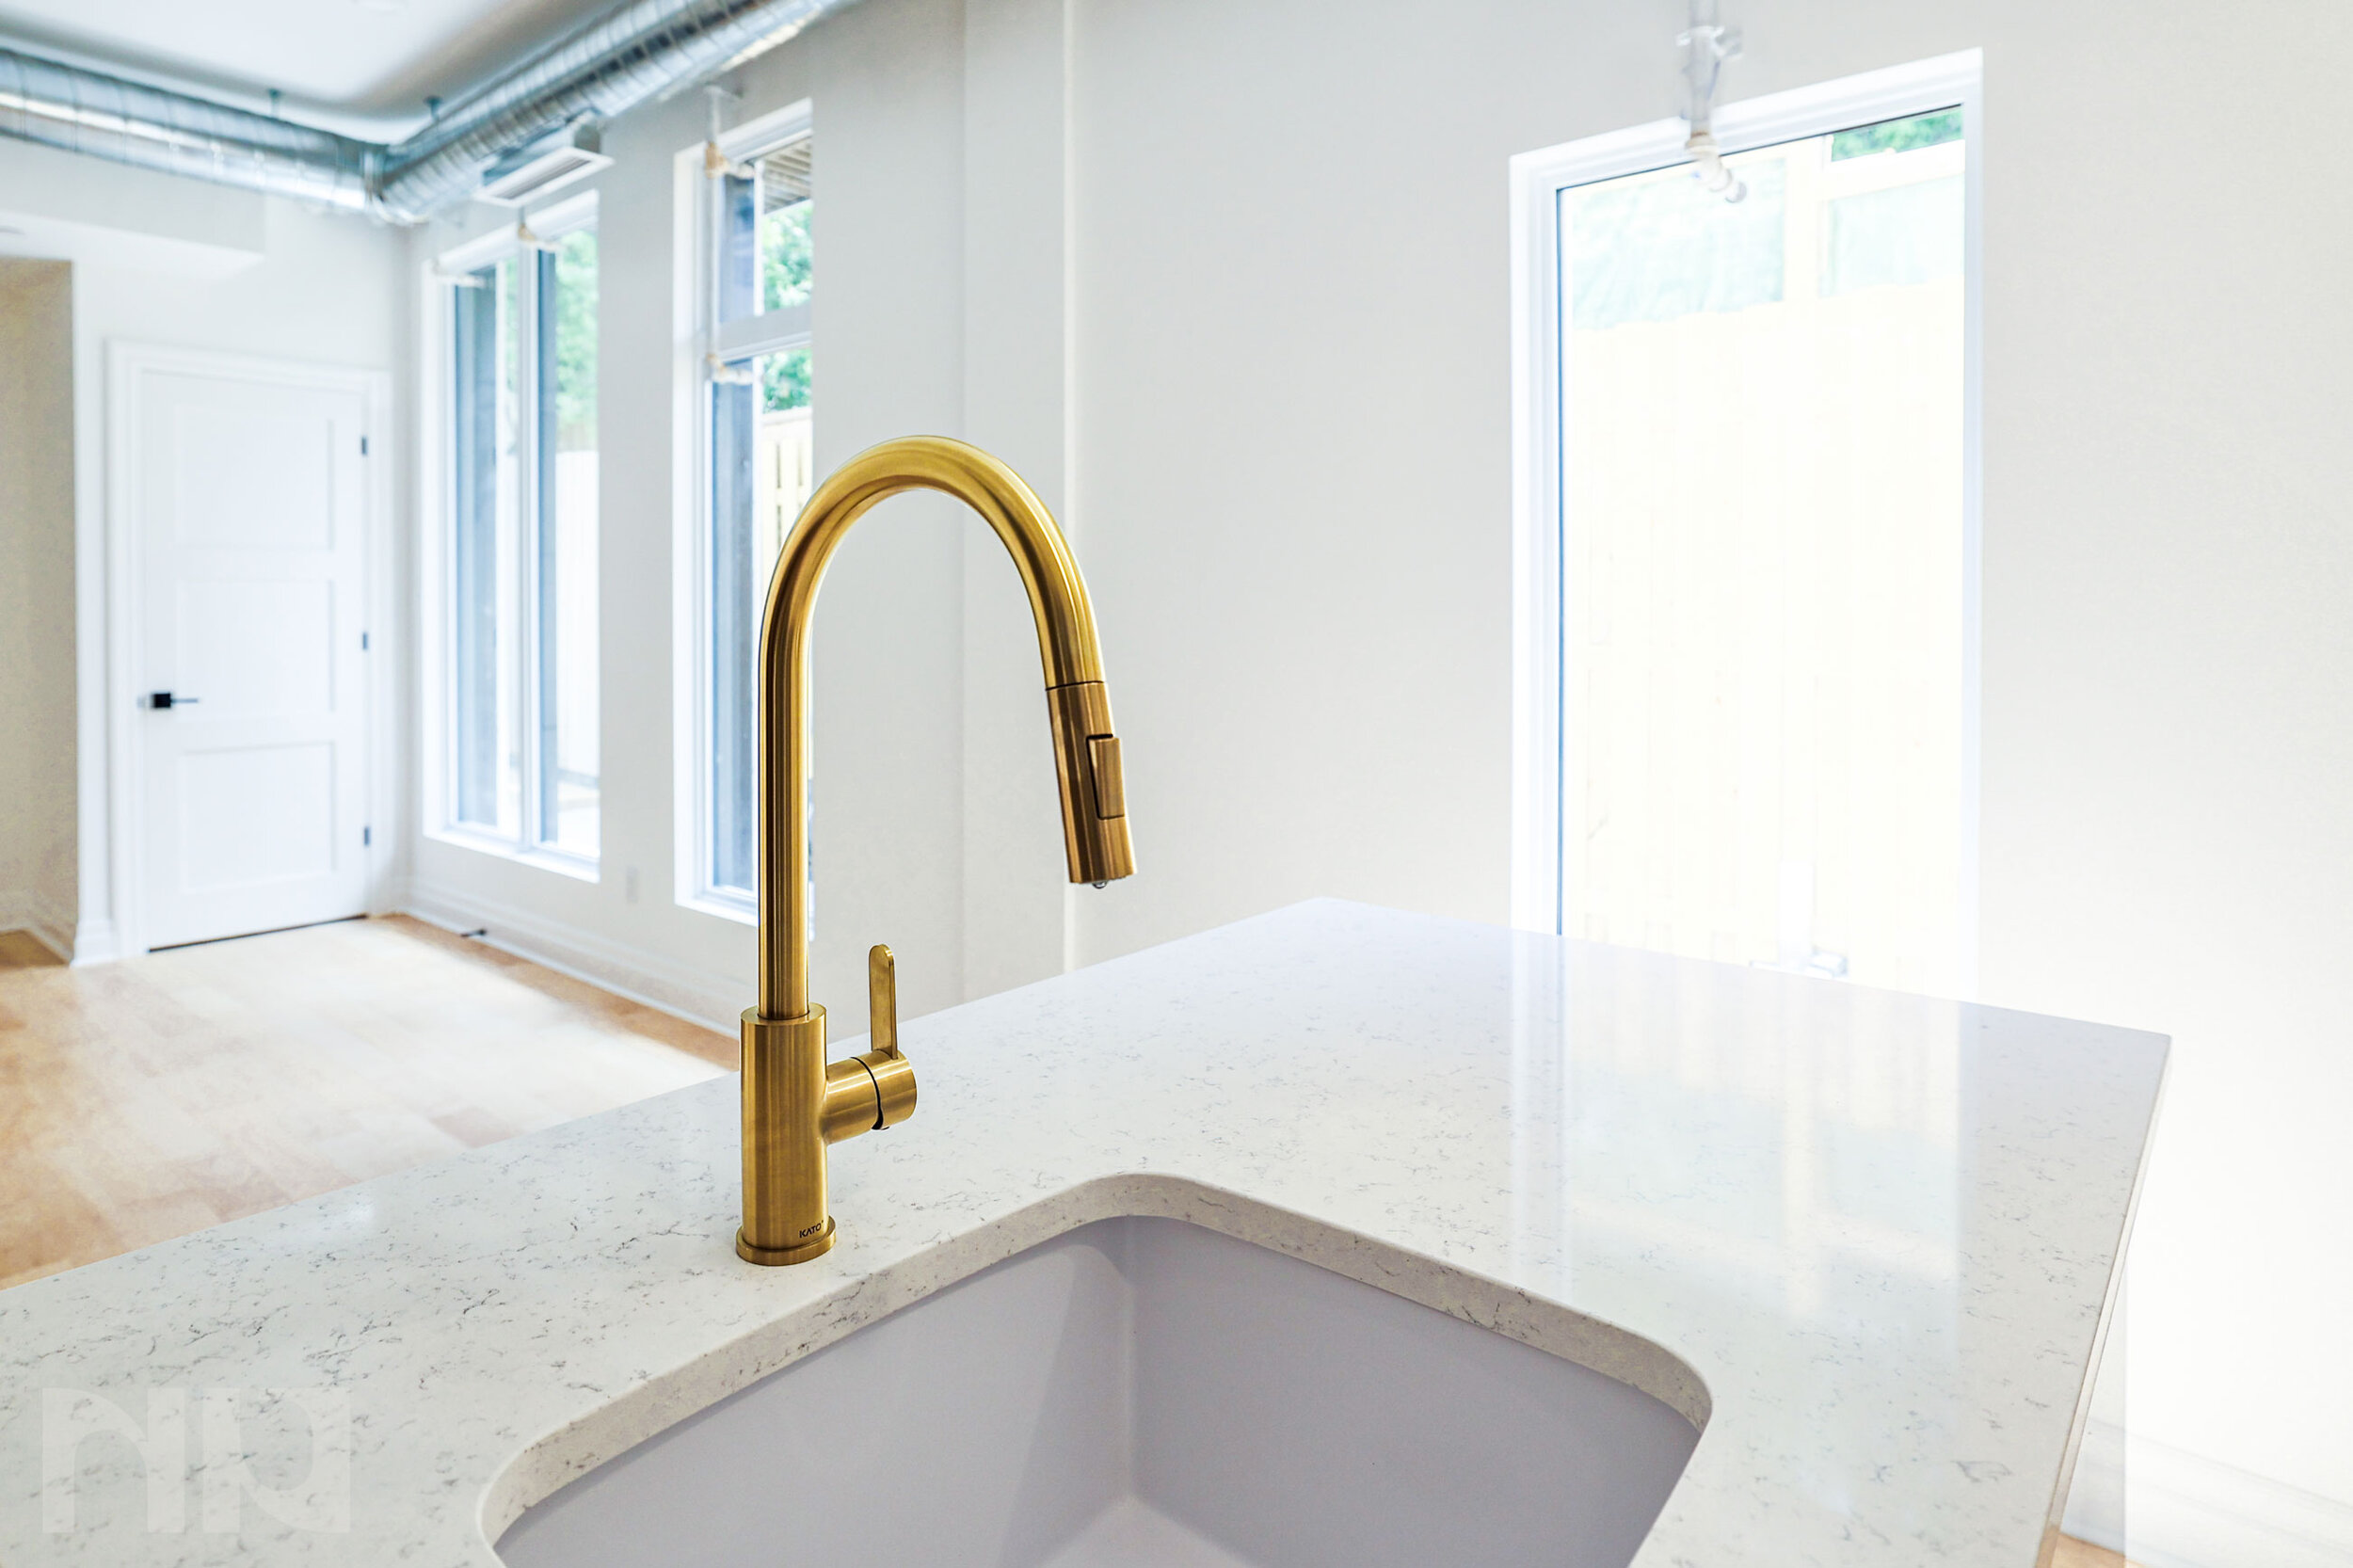
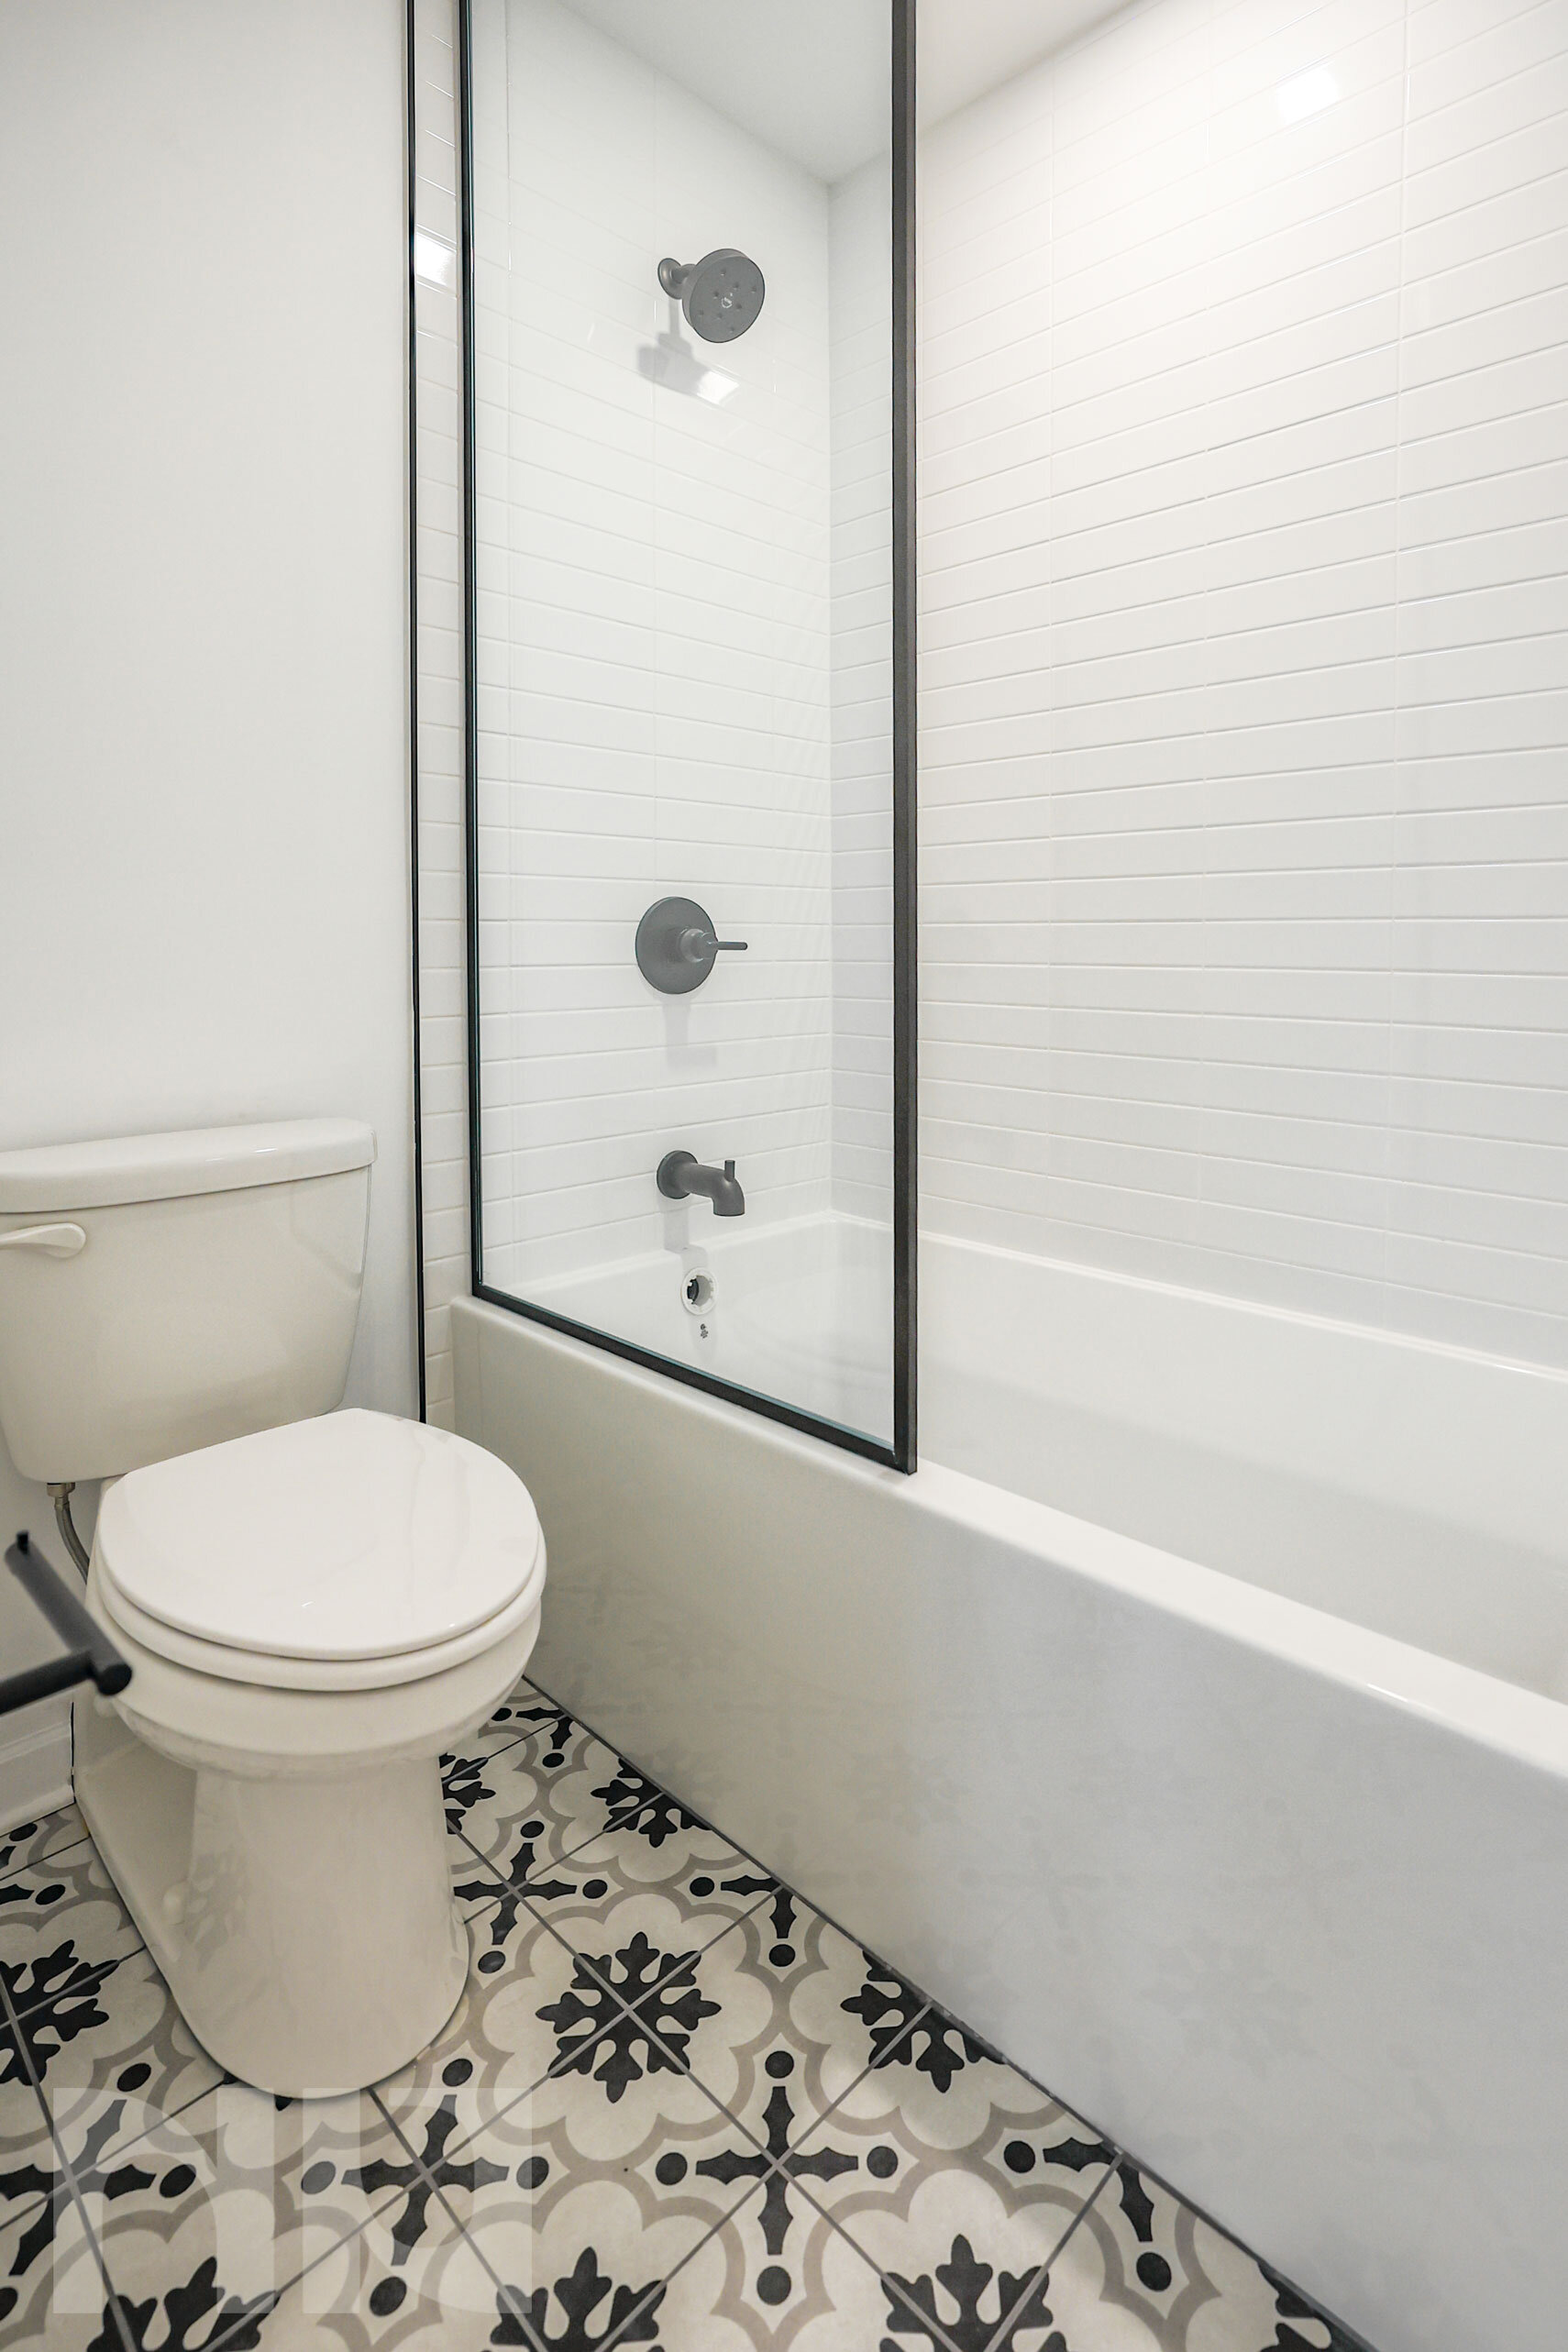
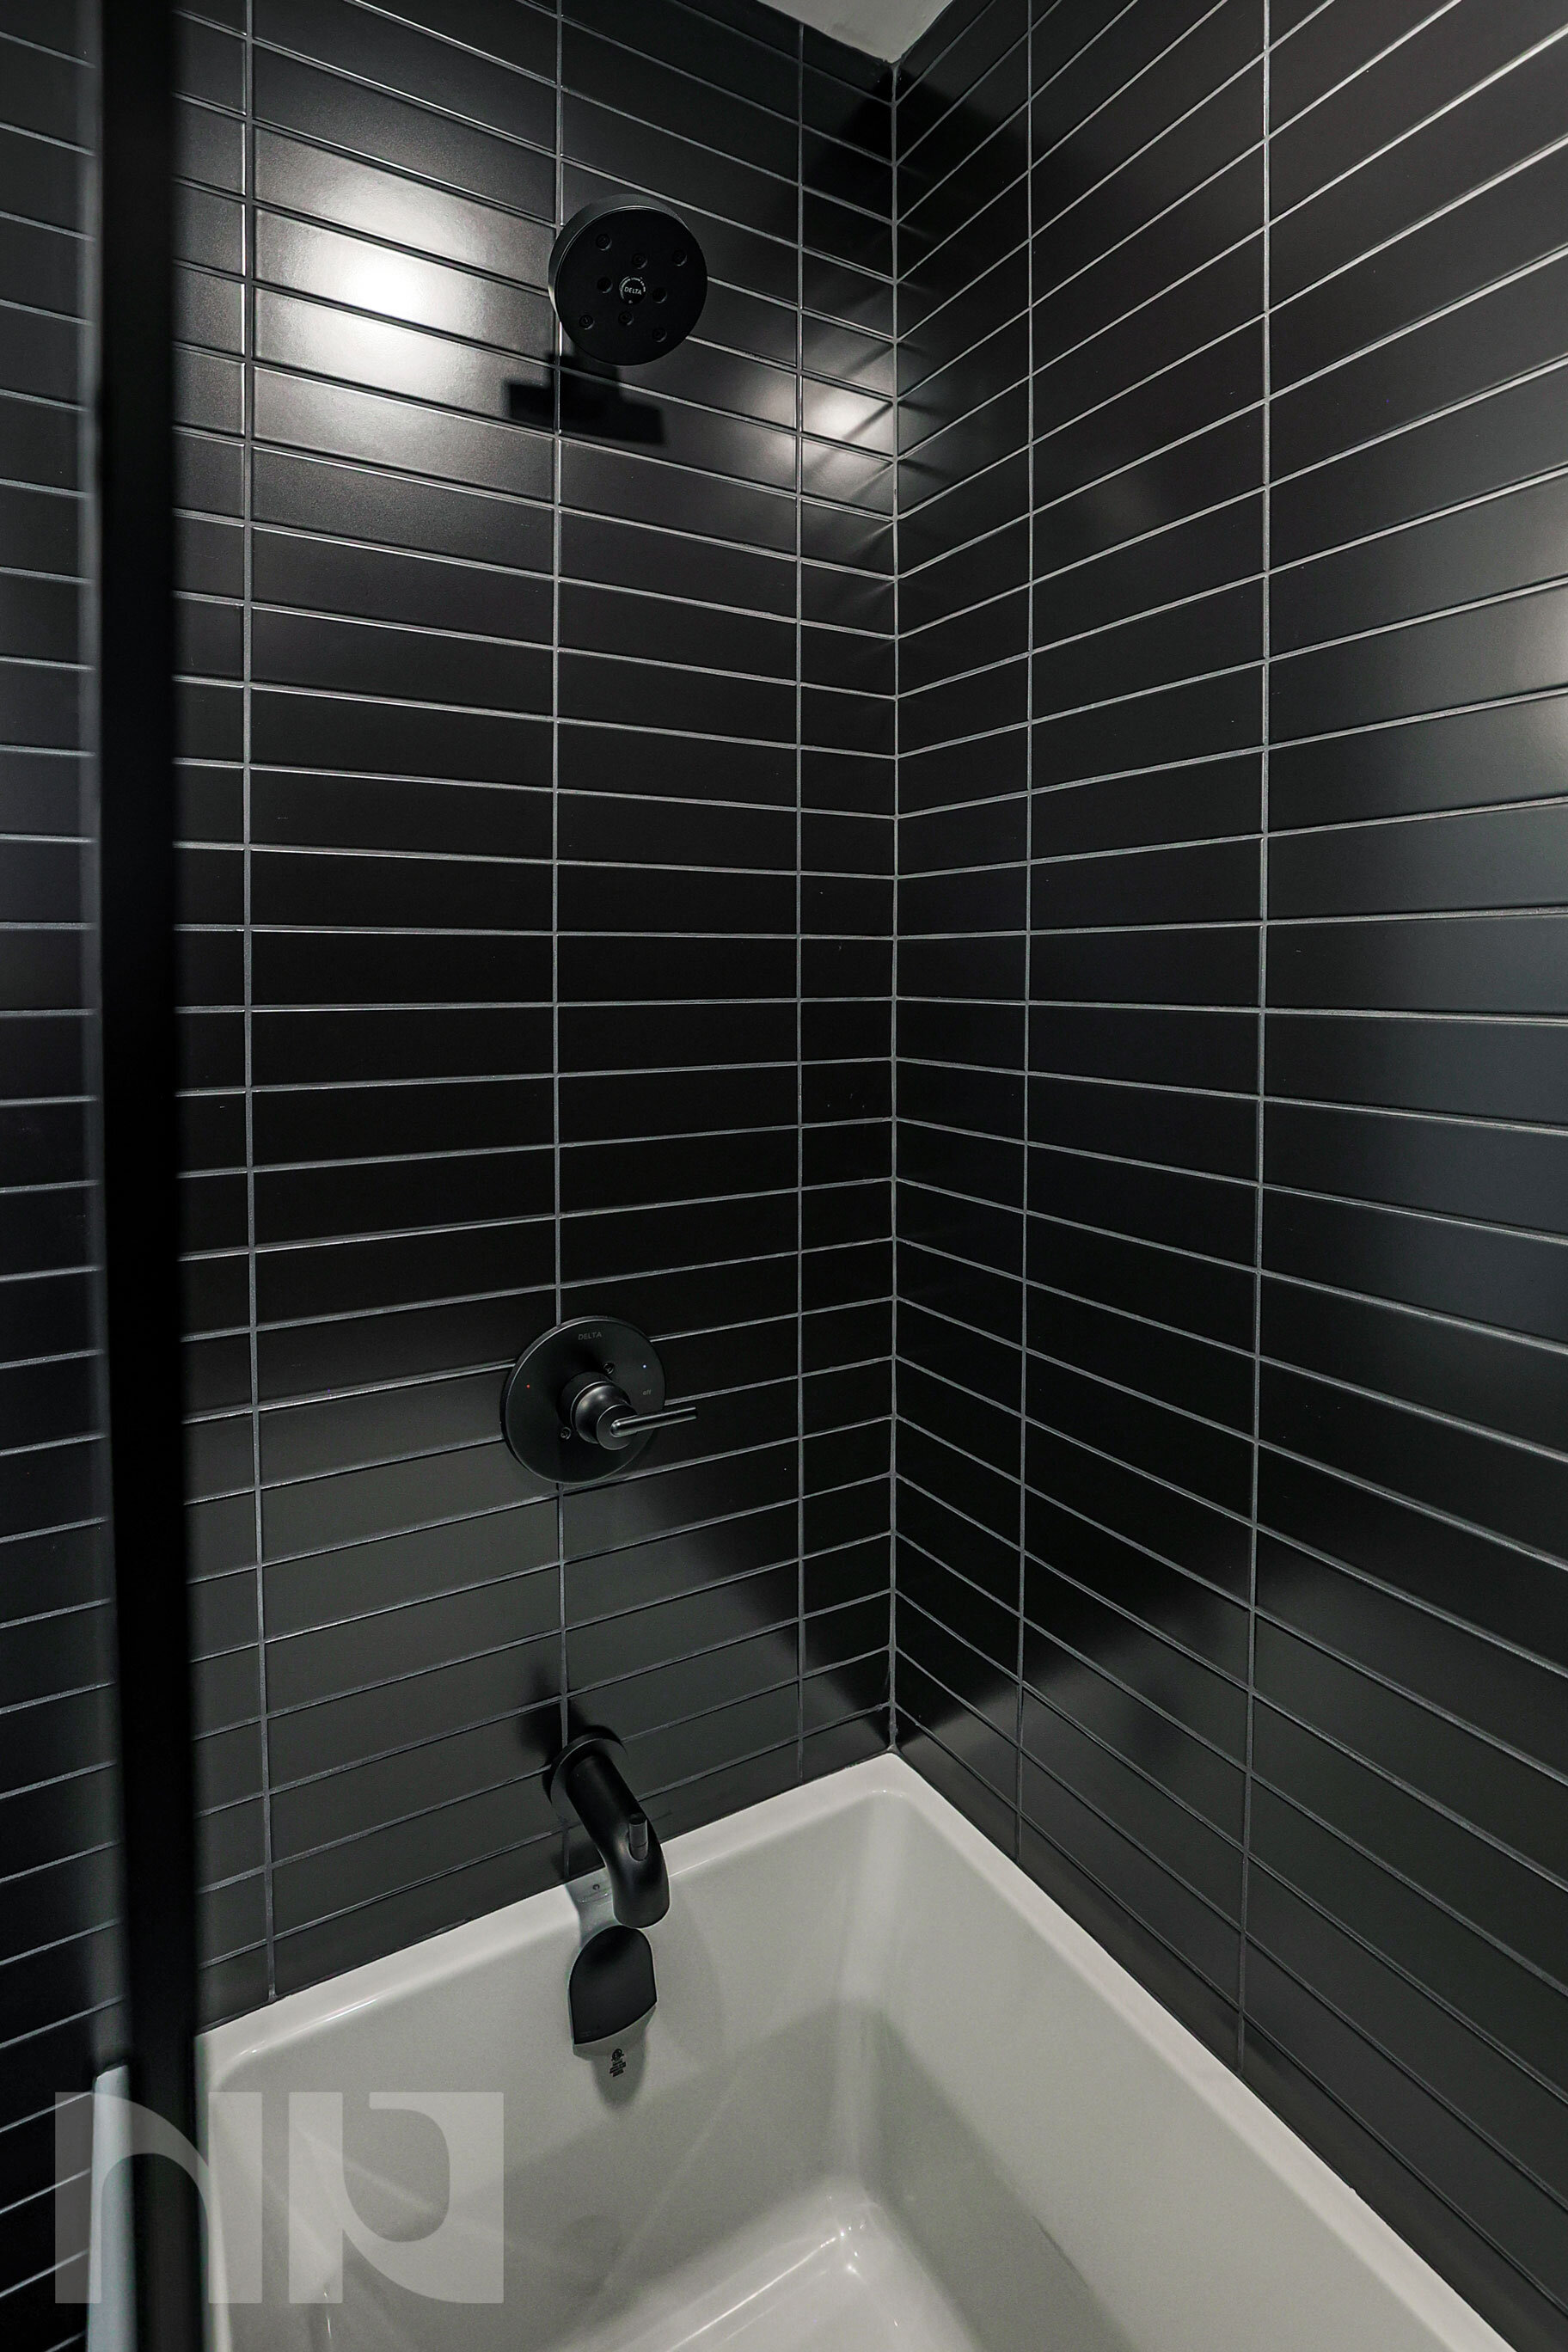
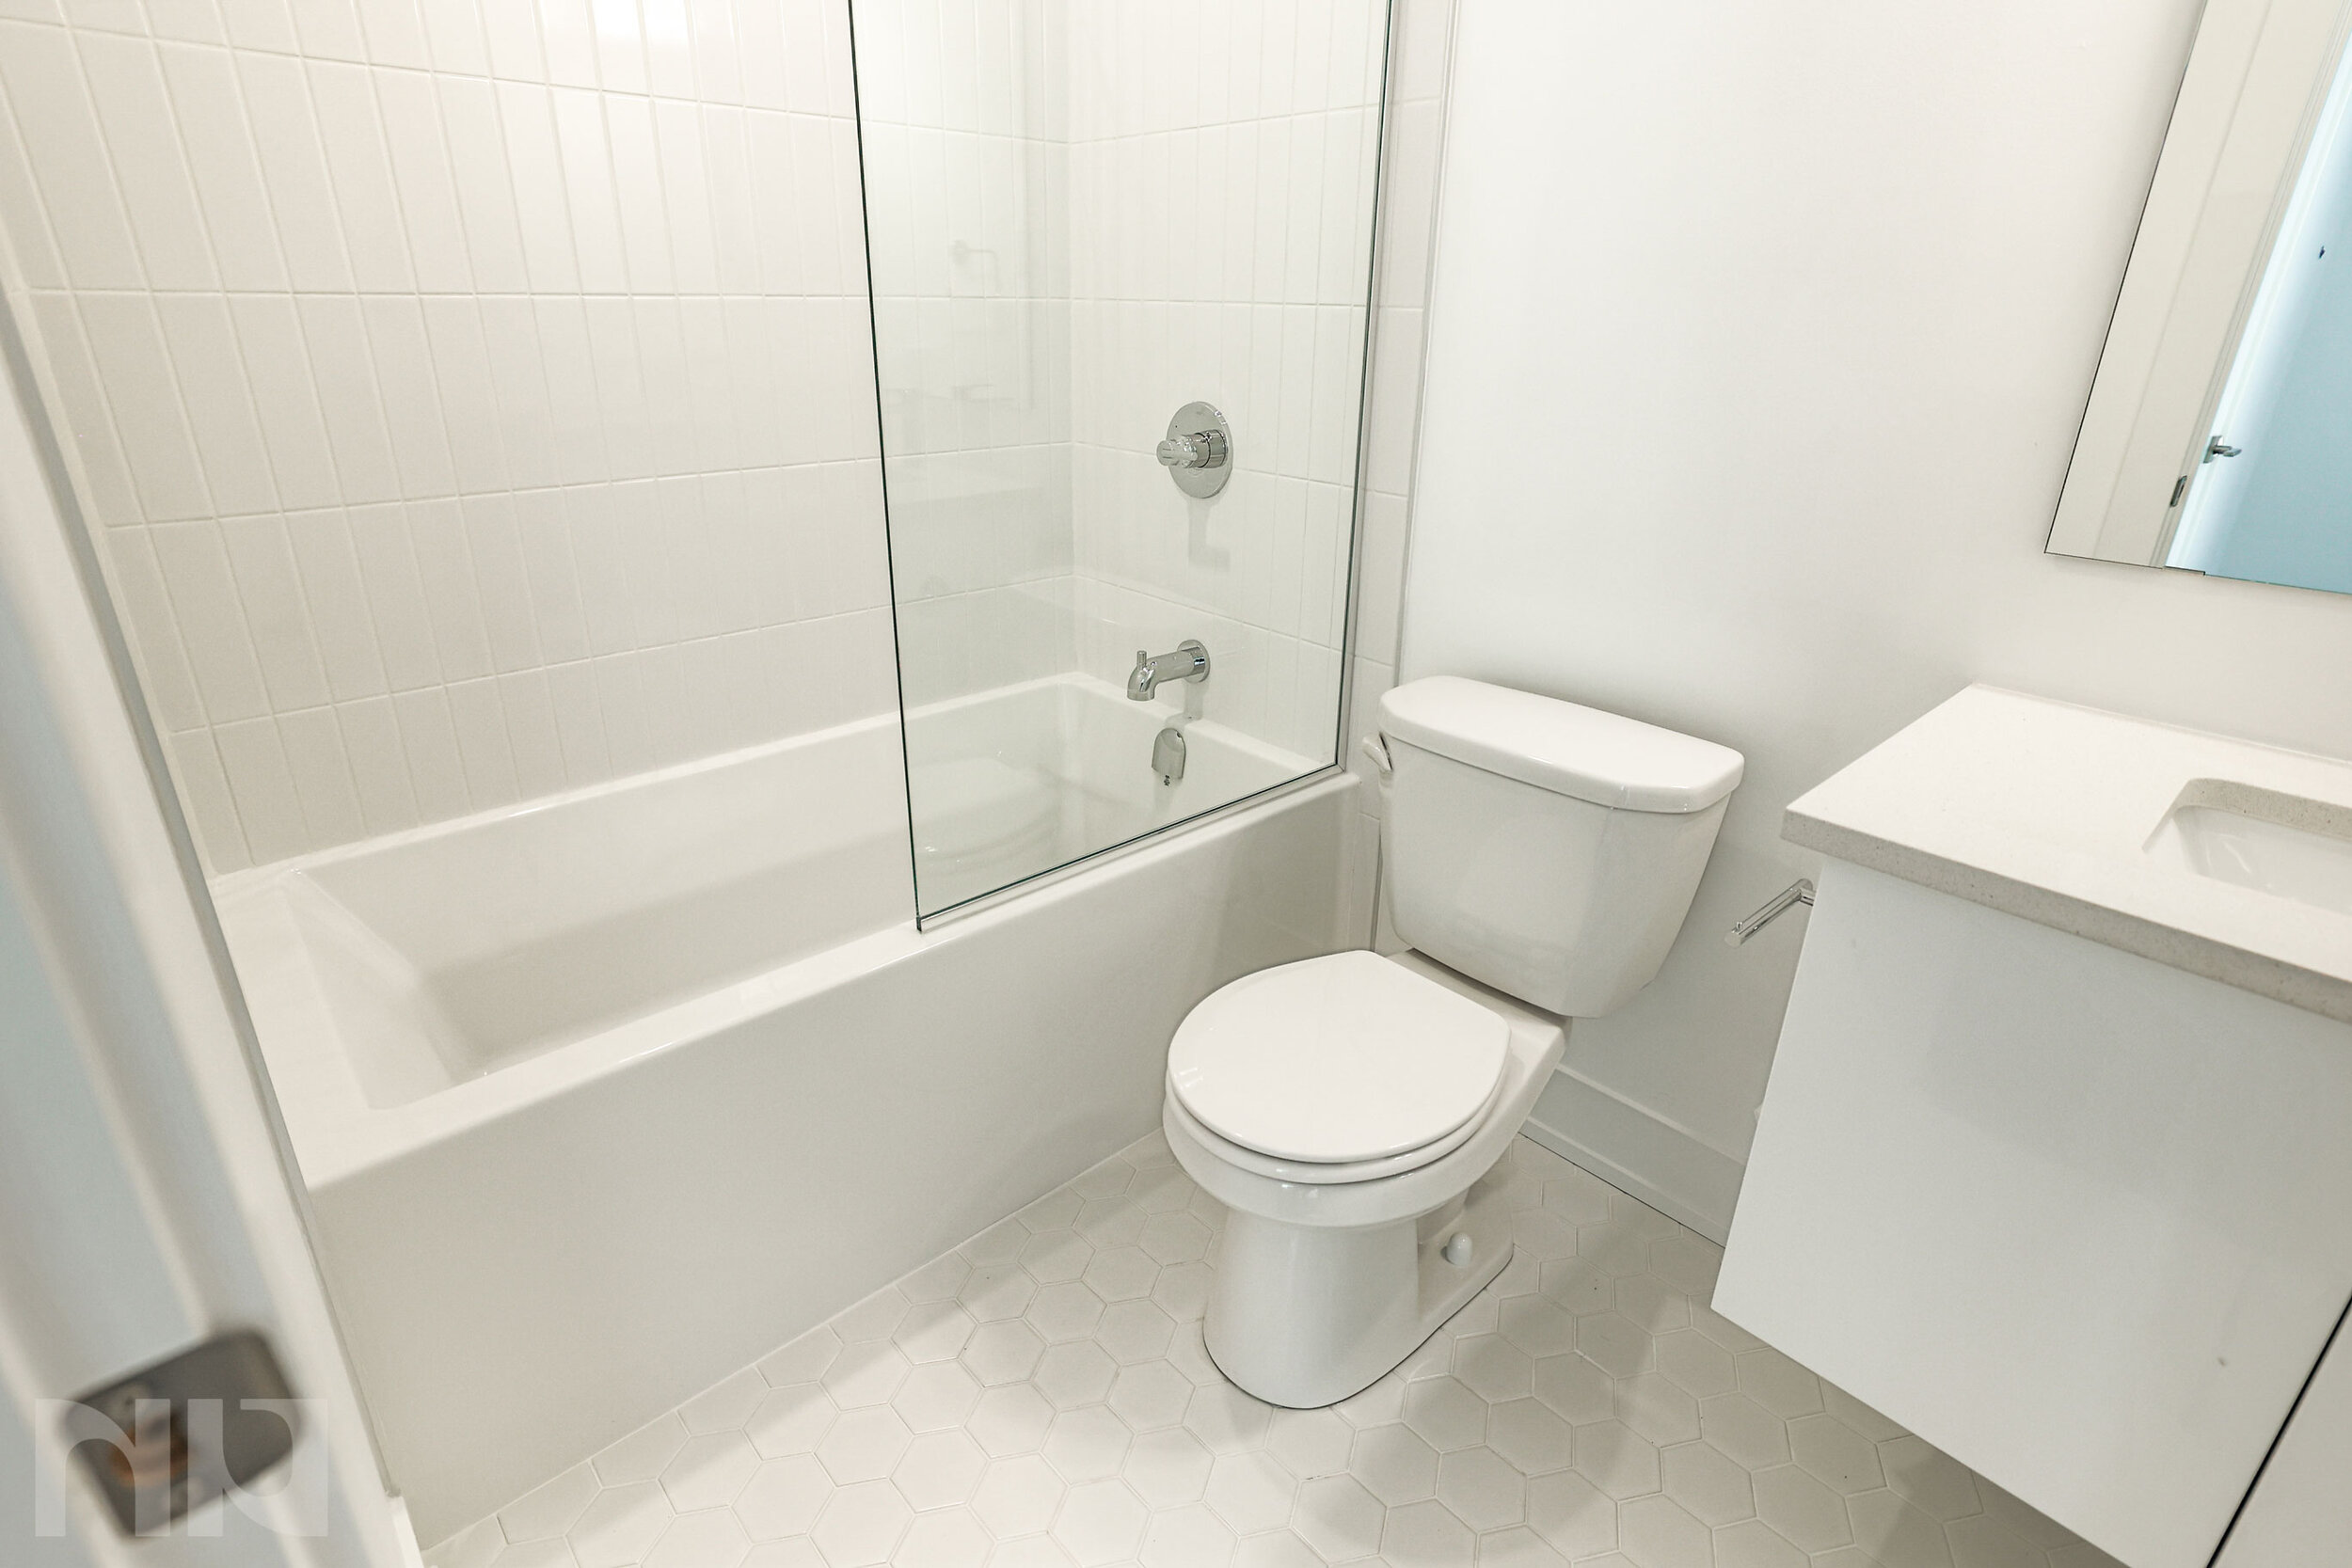
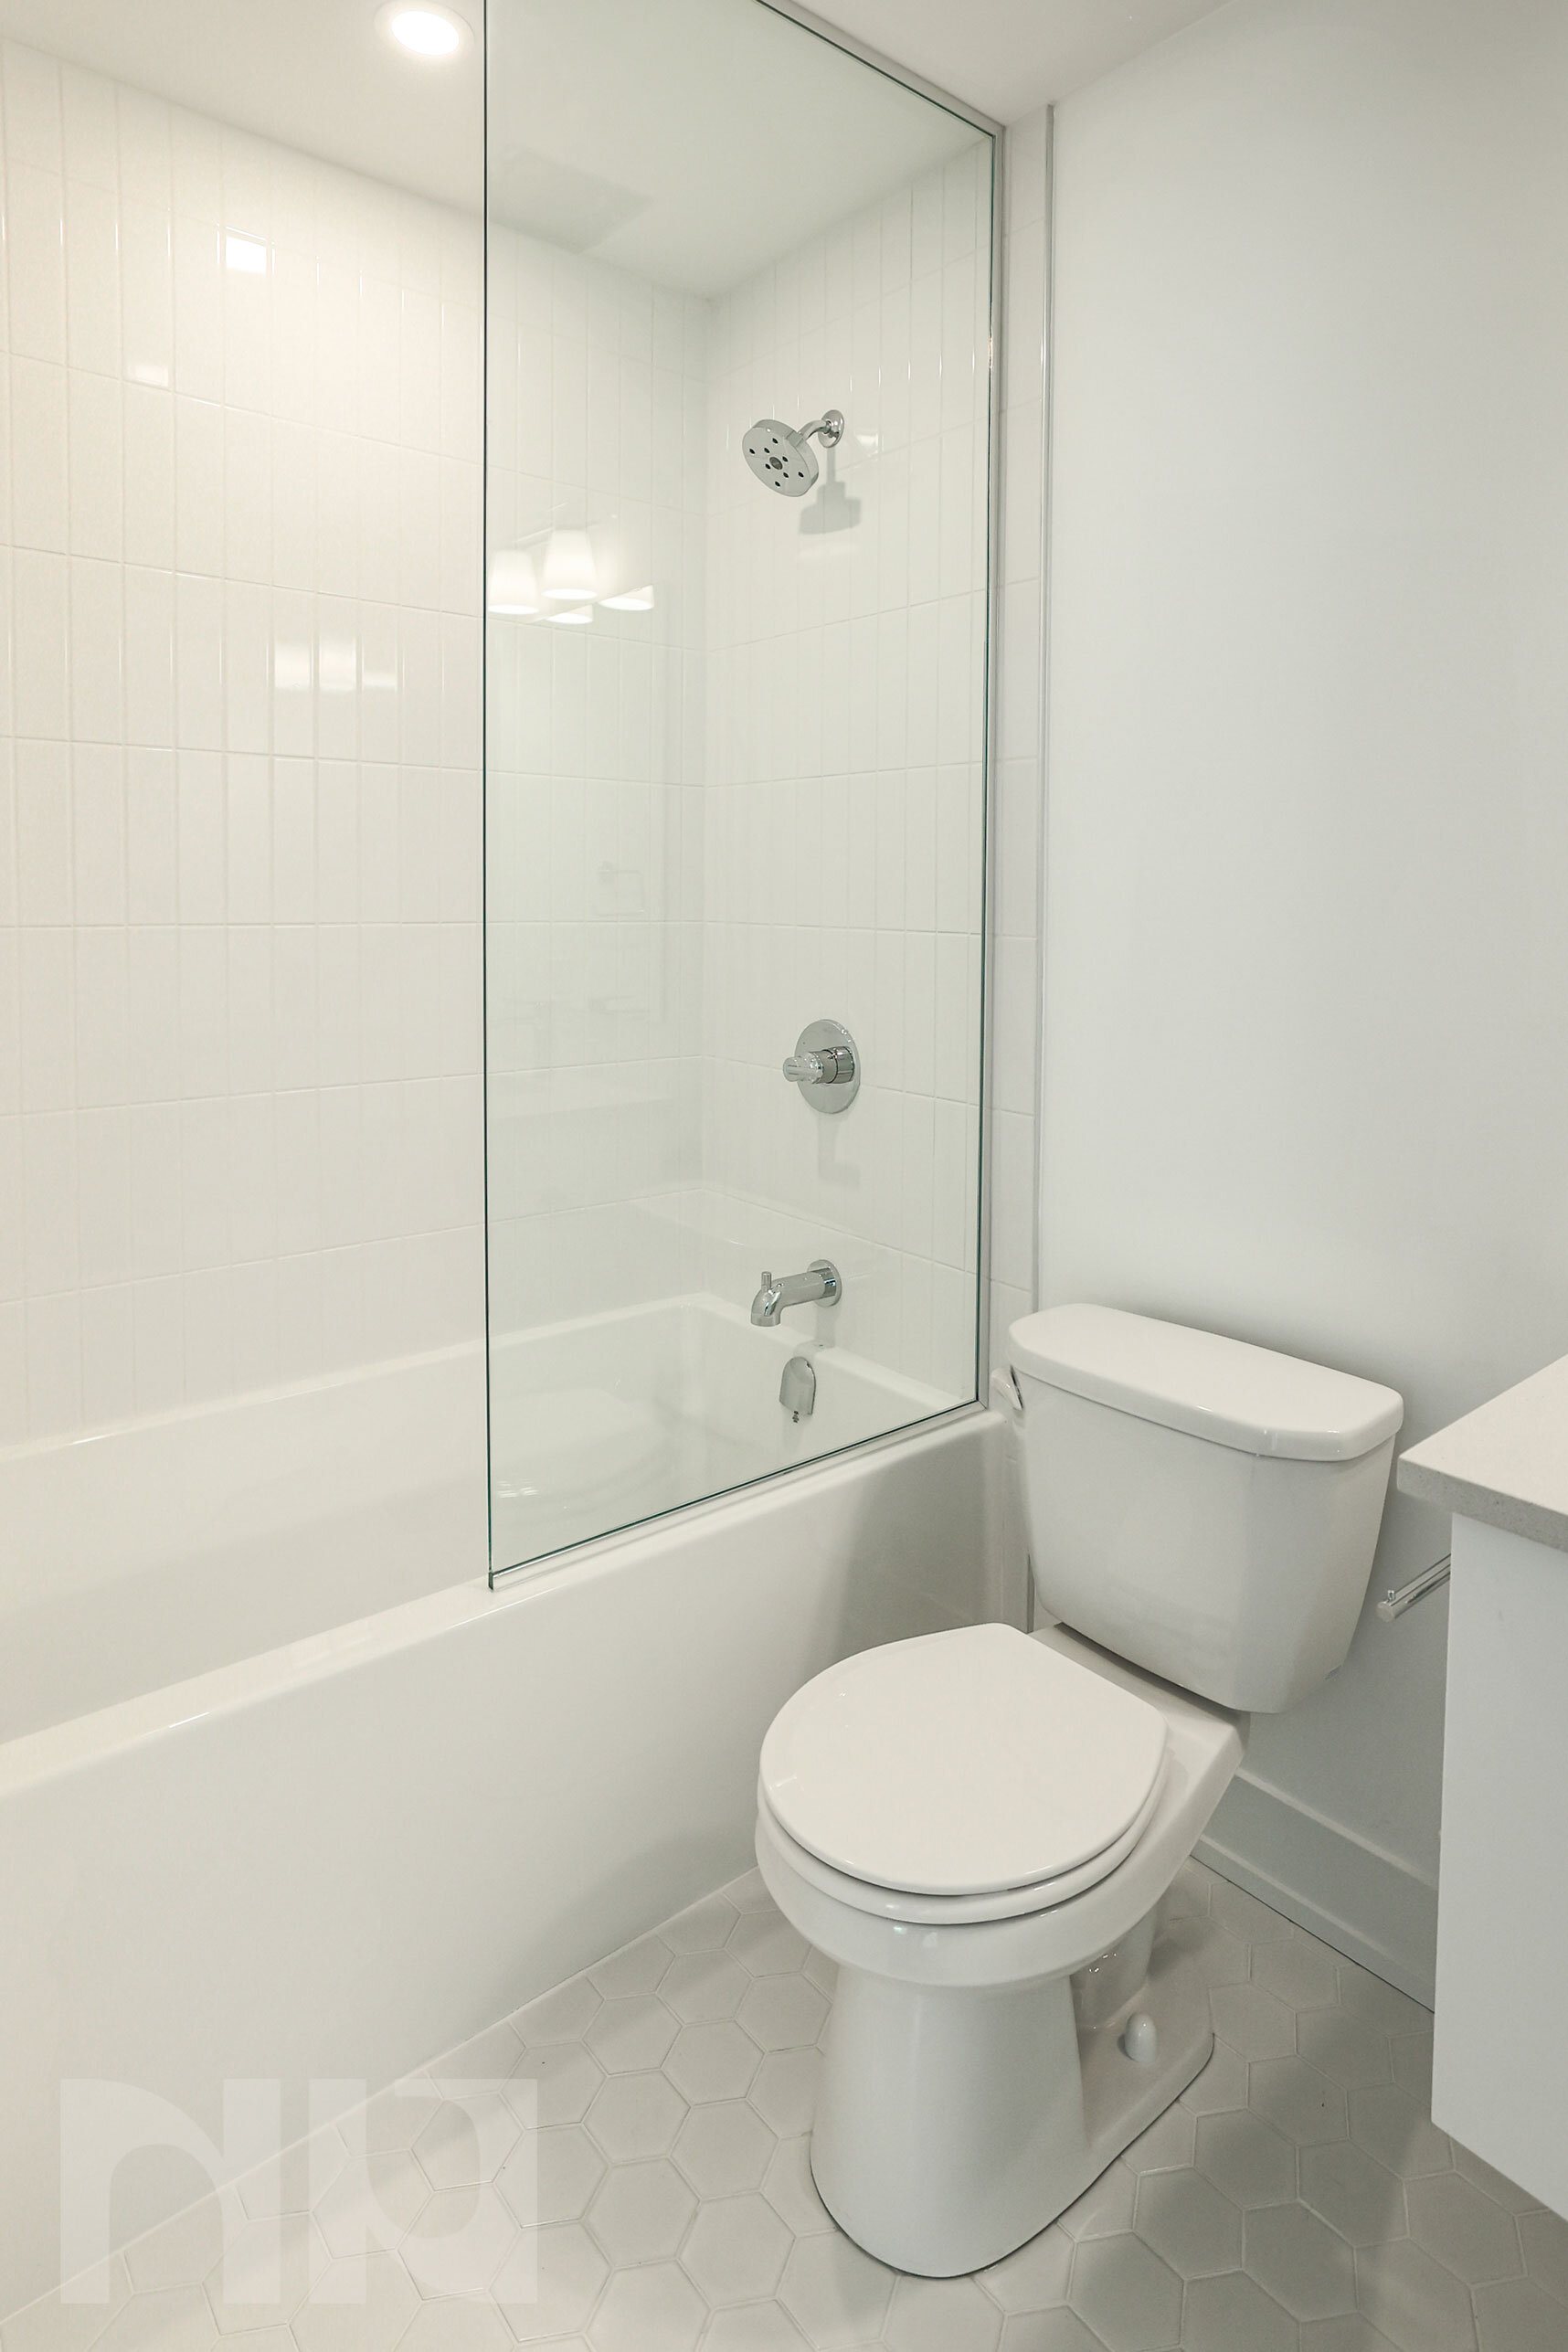
Kensington Lofts Hintonburg has done amazing and we are proud to announce the building is already 60% sold and we only have ten units remaining. These brand new loft units are designed by KODA Interiors and built by Orange Design Build. Kensington Lofts Hintonburg consists of a mix of one-bedroom, two-bedroom, and private entrance loft units. The most significant thing to note is that these units are already under construction and will be ready for immediate occupancy! Unlike traditional projects, this brand new building is available to view in person, and move-in right away. Pricing starts from the mid-$300k’s and goes up to $731,900 for the largest remaining two-bedroom penthouse unit.

Fill out the form below to learn more and to schedule a private viewing.

Ottawa Condo Market Statistics - September 2021

Blog Image Template (1).jpg

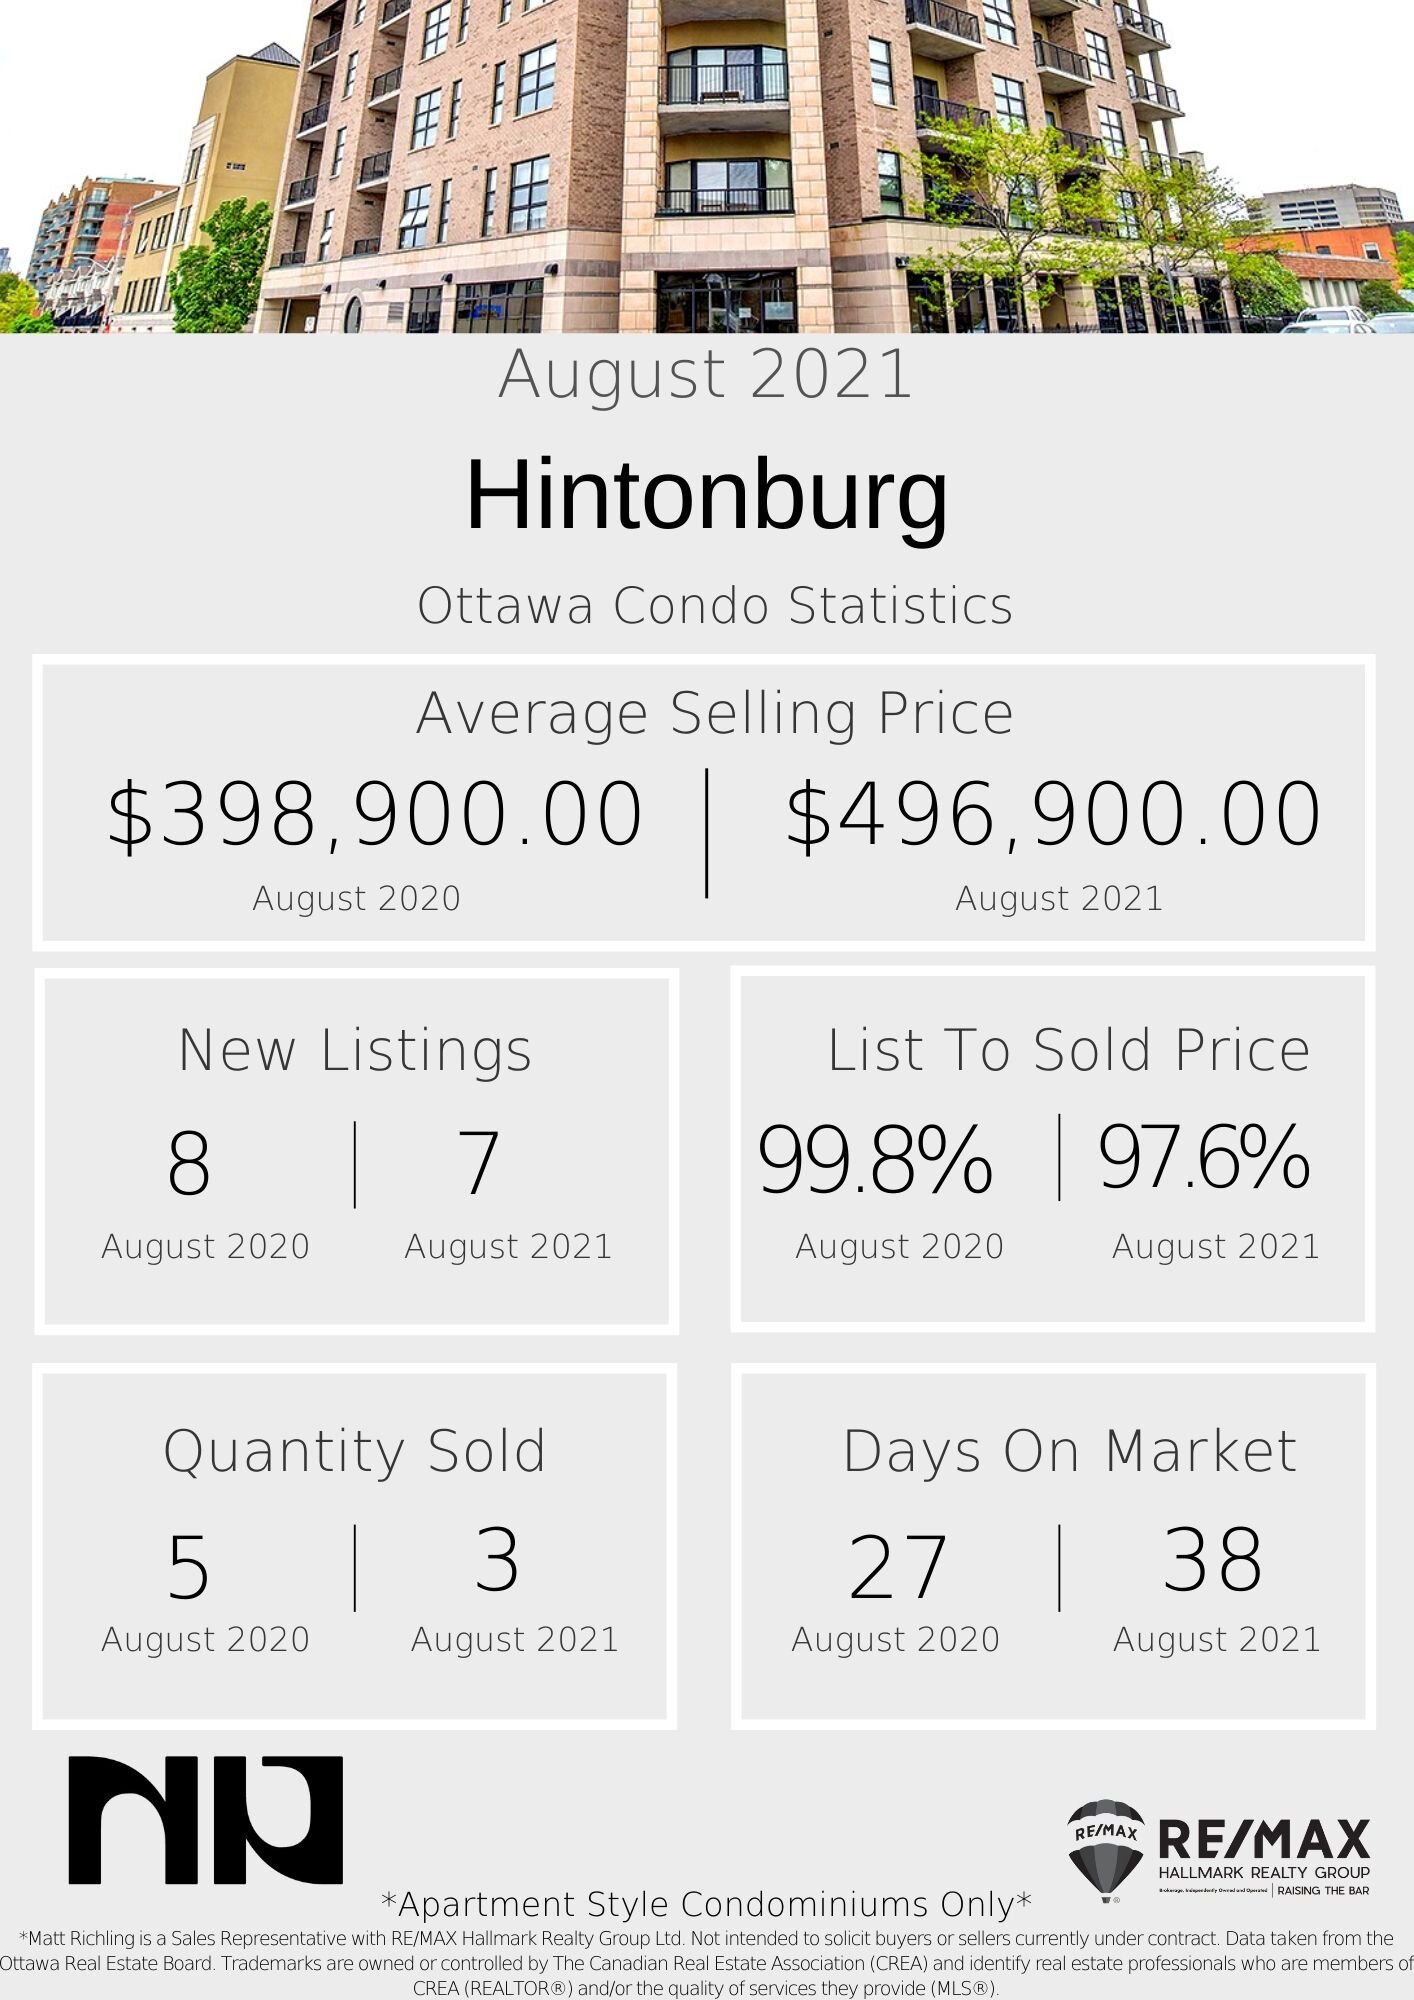
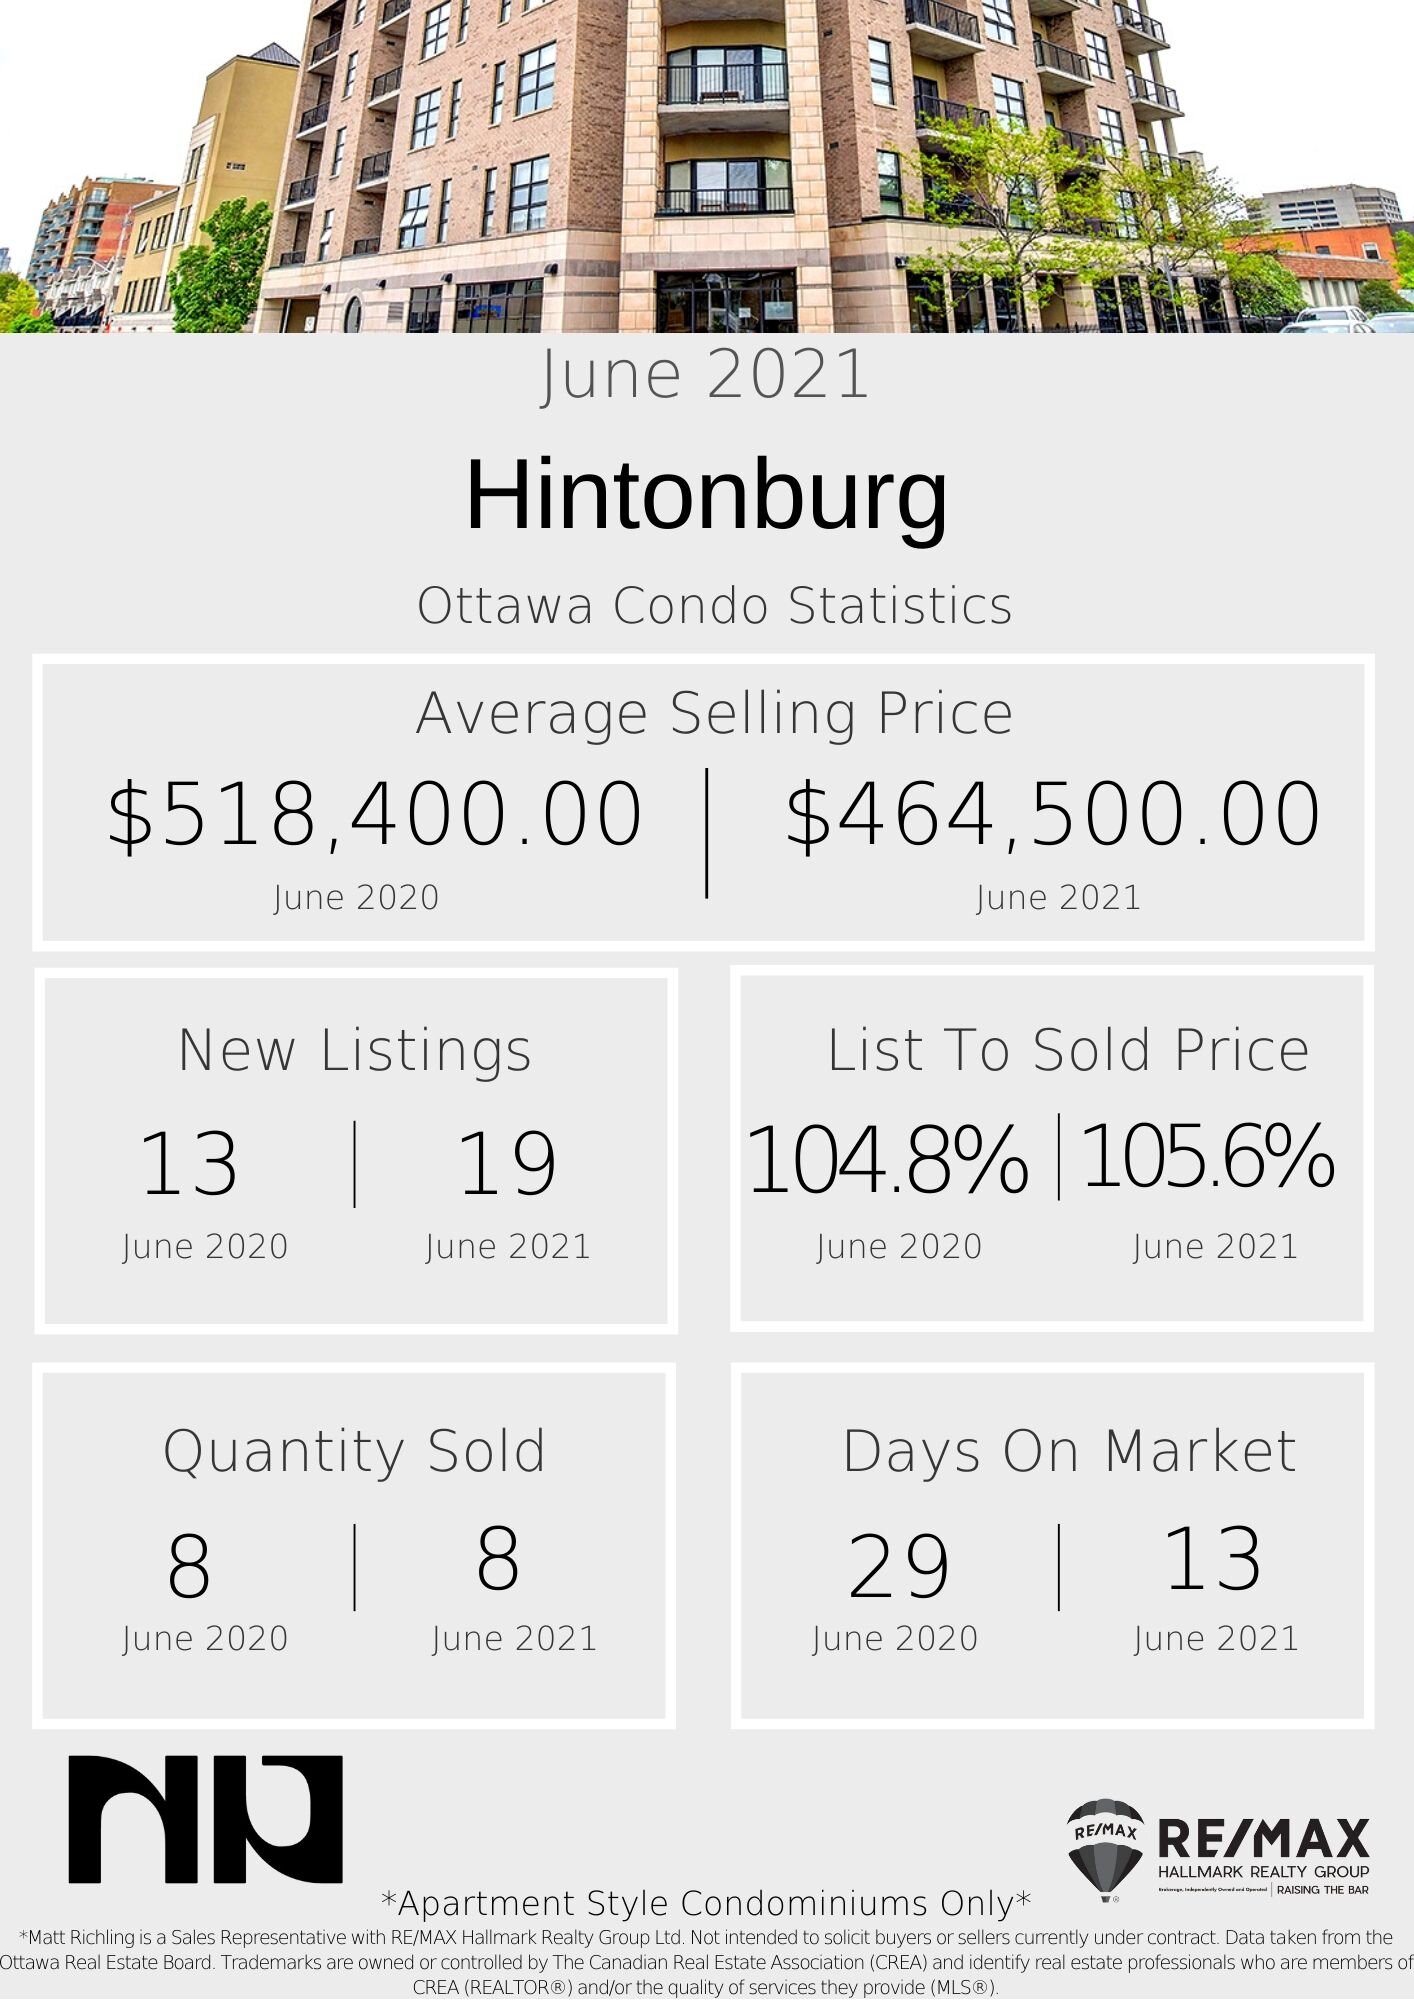
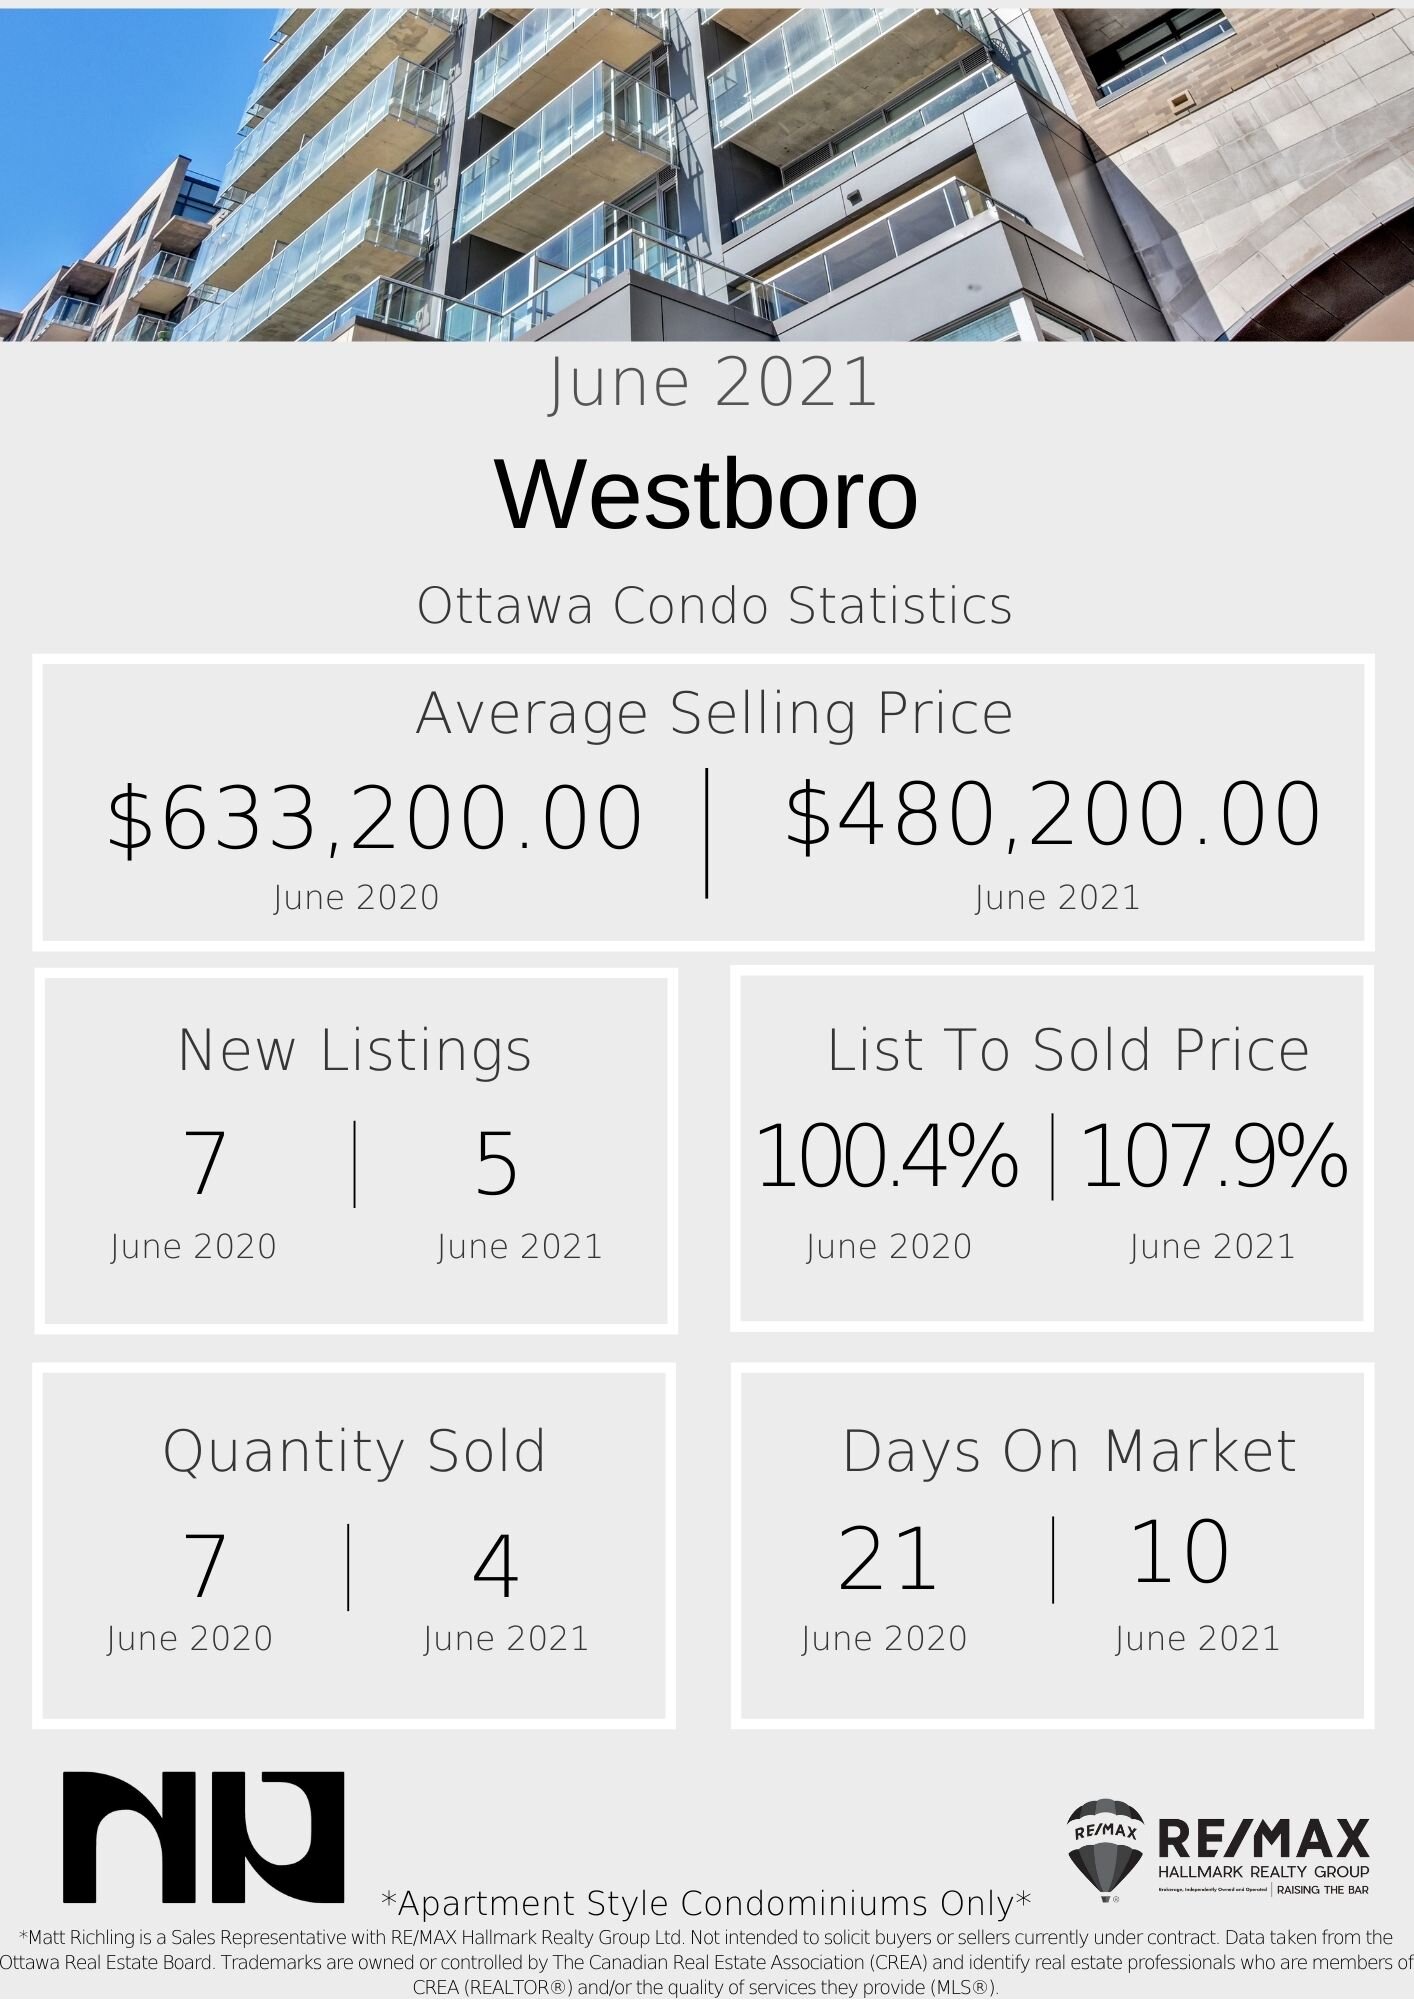
Every month we take a closer look and drill down the sales data of Ottawa condos from the previous month. Here are the statistics for September ‘21 in the top five "downtown" areas - Centretown, Byward Market and Sandyhill, Little Italy (which includes Lebreton Flats), Hintonburg, and Westboro. The information will be specific to apartment-style condominiums, and only what sold through the MLS. Also important to note that DOM (Day's On Market) is calculated to include the conditional period, which in Ottawa is almost every single transaction to be roughly 14 days.


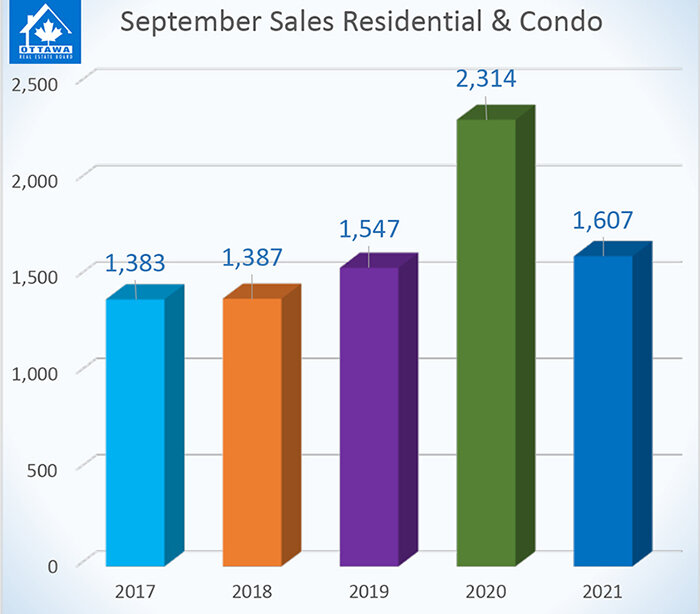
September is a great month … typically. School is back, life is back, and things start to feel normal as we move into the fall market. This year we had the election which always creates uncertainty in the market. However comparing September of 2021 to September of 2020, is not a fair comparisson to due the impact that COVID had on the market in 2020. See the graph below (provided by the Ottawa Real Estate Board) which gives you an idea….

OREB_SalesResGraph_Sept_21 Ottawa Real Estate Condos For Sale.jpeg

Looking at the data below for September, the average selling price for every area is over $500,000. To me, this is the beginning of the new reality as we see average freehold prices rise across the city, we will start to see the pricing of lower entry-level condo units also rise with increased demand.

Want to chat about your options? Fill out the form at the bottom of the page, or txt/call us directly 613-900-5700 or fill out the form at the bottom of the page.

2021 Centretown - Stats (1).jpg
2021 Hintonburg - Stats (1).jpg
2021 Byward Market & Sandy Hill -  (1).jpg
2021 Westboro - Stats (2).jpg

Do you have any questions about how this information affects your investment or looking for more information to make the best decision about your purchase? Let’s chat! Fill out the form on the bottom of the page.

Ottawa Condo Market Statistics - August 2021

Blog Image Template.jpg

Every month we take a closer look and drill down the sales data of Ottawa condos from the previous month. Here are the statistics for August ‘21 in the top five "downtown" areas - Centretown, Byward Market and Sandyhill, Little Italy (which includes Lebreton Flats), Hintonburg, and Westboro. The information will be specific to apartment-style condominiums, and only what sold through the MLS. Also important to note that DOM (Day's On Market) is calculated to include the conditional period, which in Ottawa is almost every single transaction to be roughly 14 days.


Traditionally speaking, August is one of those months that gives everyone a break between the spring and fall craziness. Last year, this was thrown out the window due to covid, but this year we are starting to get back to a more normal market expectation. Usually, when I am writing these I am also looking at last month’s numbers to help compare not only year-over-year but month-to-month. CLICK HERE For July 2021 stats. One thing we easily noticed was that every area saw - month over month - a decrease in the average selling price, lower list to sold price, and more days on market (with the exception of Westboro - which still saw a lower list to sold price ratio). Nothing dramatic, but exactly what we were expecting going into the month. 

I asked Husnain Ali - to break down what he is seeing in the market right now. “Right now I am seeing more inventory on market, less holding off of offers, multiple offers are less common but still prevalent. Certainly seeing a larger buyer pool than the last couple months, and we are moving more towards a more balanced market”

Spoke with Aly Ball for her take. “The market after a slight lull in August has started to strengthen and we are seeing multiple offers again. Prices are holding strong.”

Want to chat about your options? Fill out the form at the bottom of the page, or txt/call us directly 613-900-5700 or fill out the form at the bottom of the page.

2021 Centretown - Stats.jpg
2021 Hintonburg - Stats.jpg
2021 Byward Market & Sandy Hill - .jpg
2021 Westboro - Stats.jpg

Do you have any questions about how this information affects your investment or looking for more information to make the best decision about your purchase? Let’s chat! Fill out the form on the bottom of the page.

Claridge Moon - Construction and Sales Update - August 2021

Claridge Moon Condo Ottawa Construction Update.jpg

**For more information about Claridge Moon, visit our Claridge Moon project page HERE. All information about the project will be located here, including floorplans, renderings, construction updates, news articles, pricing, etc. **

Claridge has continued to move units and make progress with construction on Claridge Moon. Located at 340 Queen Street in Centretown, Claridge Moon will be the first condo building in Ottawa located directly attached to an LRT transit stop. The building is current 69% sold out (183 sold out of 266). The average size for the remaining units is 830sqft, with the average price per sqft for the remaining units at $749/sqft. Prices start at $441,000 for an Ariel Floorplan on the 2nd floor - 630sqft.

For more information about pre-construction condos in Ottawa, fill out the form at the bottom of the page.

Claridge Moon Ottawa Condos Construction Update August 2021.jpg
IMG-3039.jpg

Ottawa Condo Market Statistics - July 2021

Blog Image Template.jpg

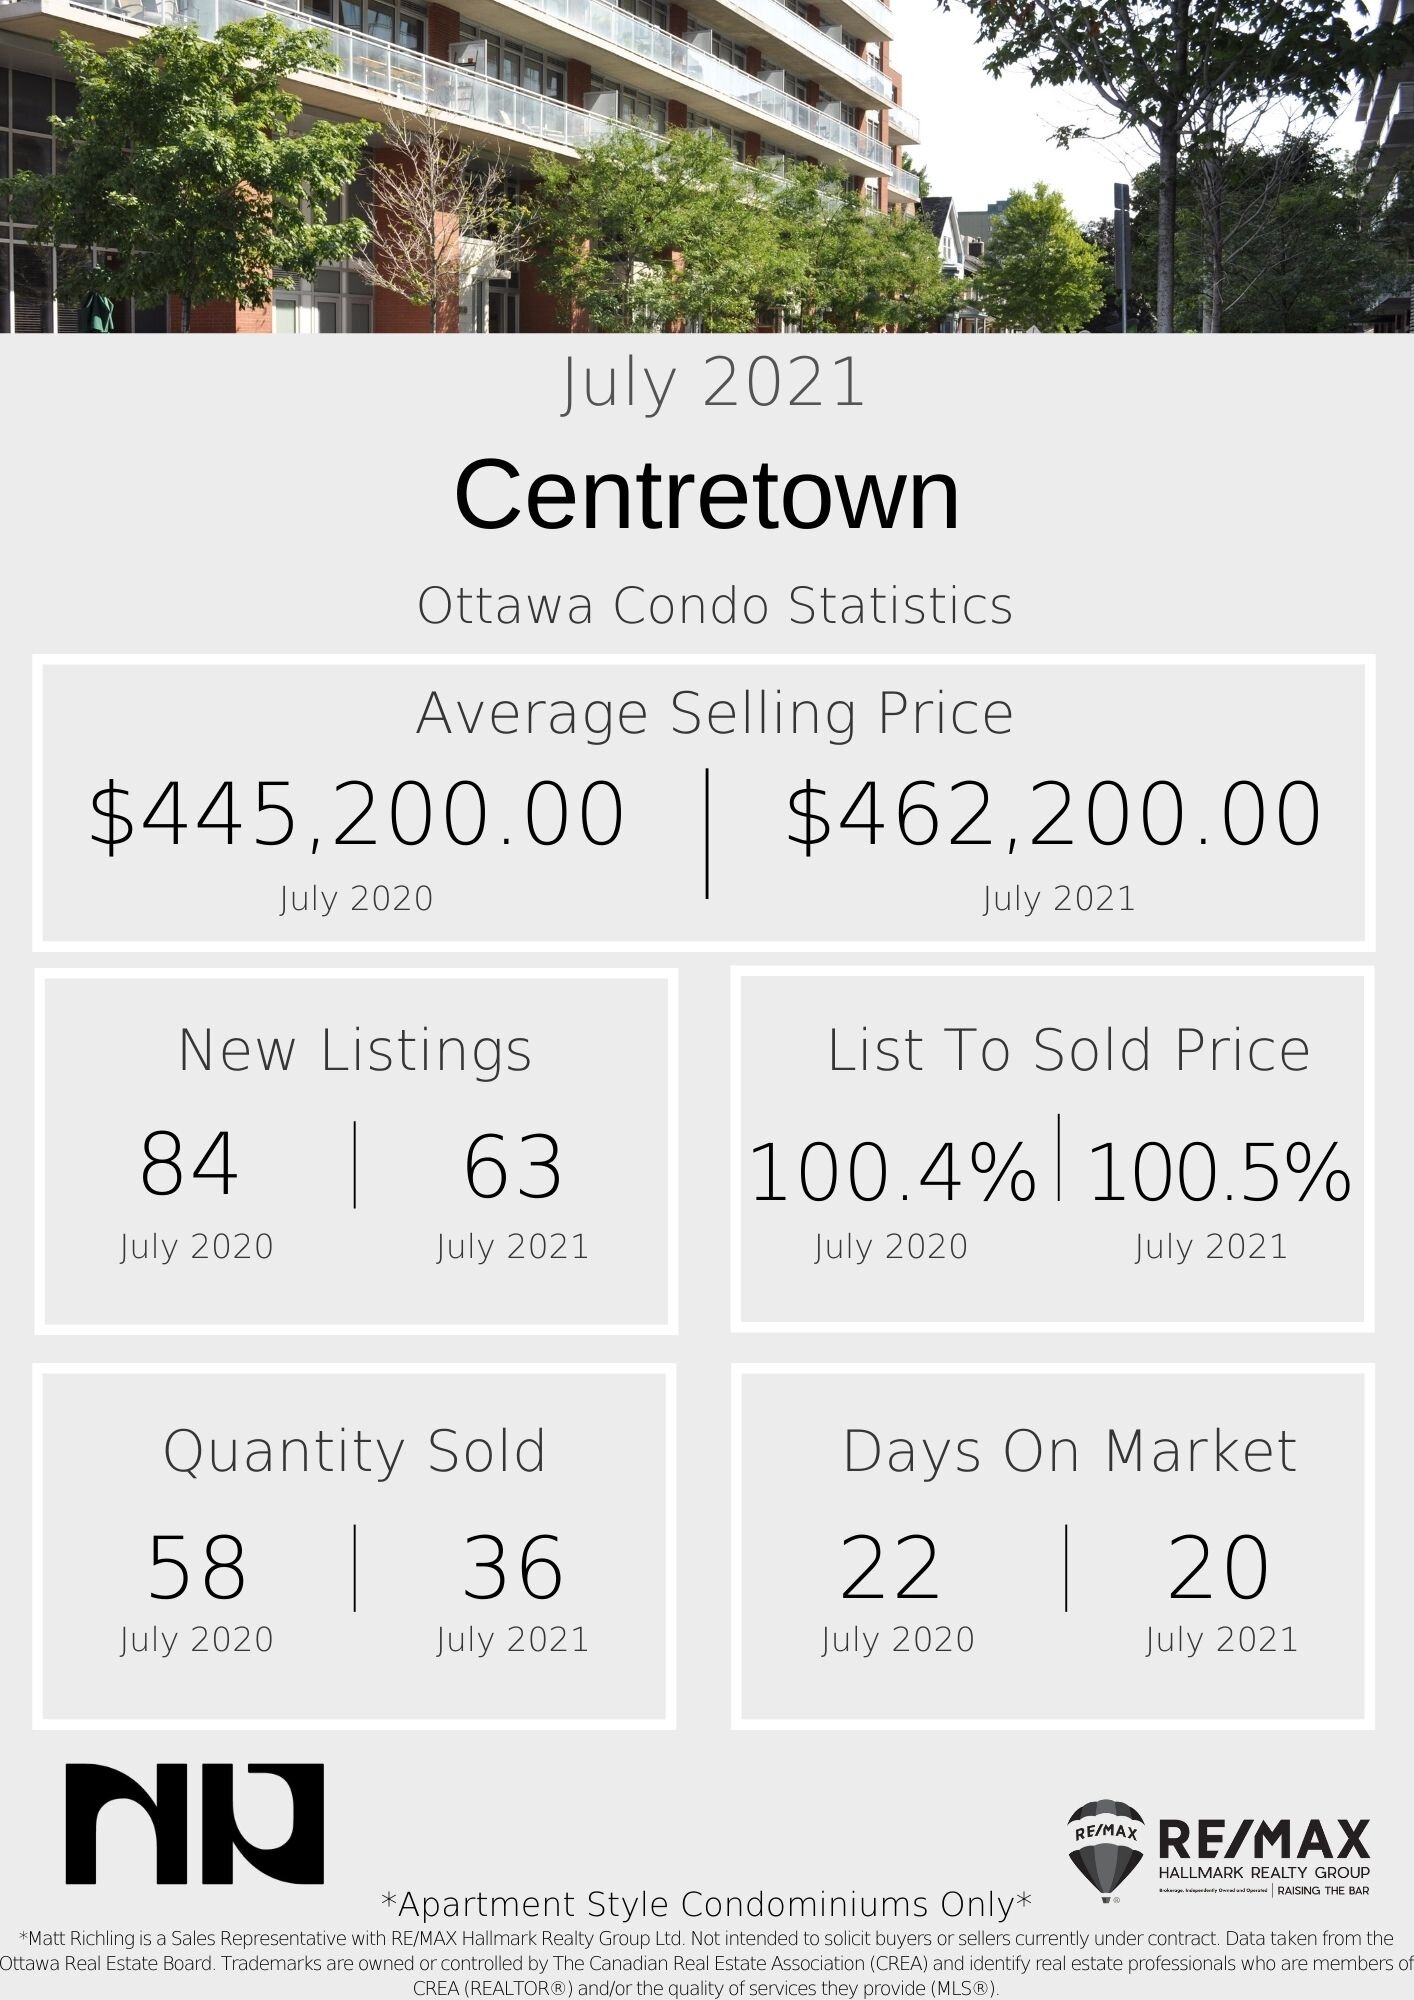
Every month we take a closer look and drill down the sales data of Ottawa condos from the previous month. Here are the statistics for July ‘21 in the top five "downtown" areas - Centretown, Byward Market and Sandyhill, Little Italy (which includes Lebreton Flats), Hintonburg, and Westboro. The information will be specific to apartment-style condominiums, and only what sold through the MLS. Also important to note that DOM (Day's On Market) is calculated to include the conditional period, which in Ottawa is almost every single transaction to be roughly 14 days.


Ahhhhhh the start of summer. Cottages, sun, patios, and parents looking at places for their children who are headed back to school in September. The time in which real estate starts to ease off the gas and start to balance out for a few weeks. While properties are still selling - most of the areas are seeing a reduced number of sales, with a lower list price to sale price. We are seeing fewer listings that are priced below market value and holding off offers, instead, many are now listing at market value. While some listings are still holding off offers until a set date, there is no guarantee that they will receive any. While these listings might seem ripe for a quick underpriced buy from a buyer, the seller is often holding a certain price in their head and if they don’t get an offer to their satisfaction, we usually see them list around that number. That being said, there are still a bunch of good options for buyers who are looking to secure something before school starts, or while the market is slightly eased.

Want to chat about your options? Fill out the form at the bottom of the page, or txt/call me directly 613-286-9501.

2021 Centretown - Stats.jpg
2020 Hintonburg - Stats.jpg
2021 Little Italy - Stats.jpg
2021 Byward Market & Sandy Hill - .jpg

Do you have any questions about how this information affects your investment or looking for more information to make the best decision about your purchase? Let’s chat! Fill out the form on the bottom of the page.

The Charlotte - Construction and Sales Update - July 2021

The-Charlotte-Construction-Update July 2021.jpg

**For more information about The Charlotte visit The Charlotte page HERE, which has everything about the building in one place. This includes the floor plans, pricing, renderings, sales updates, etc. **

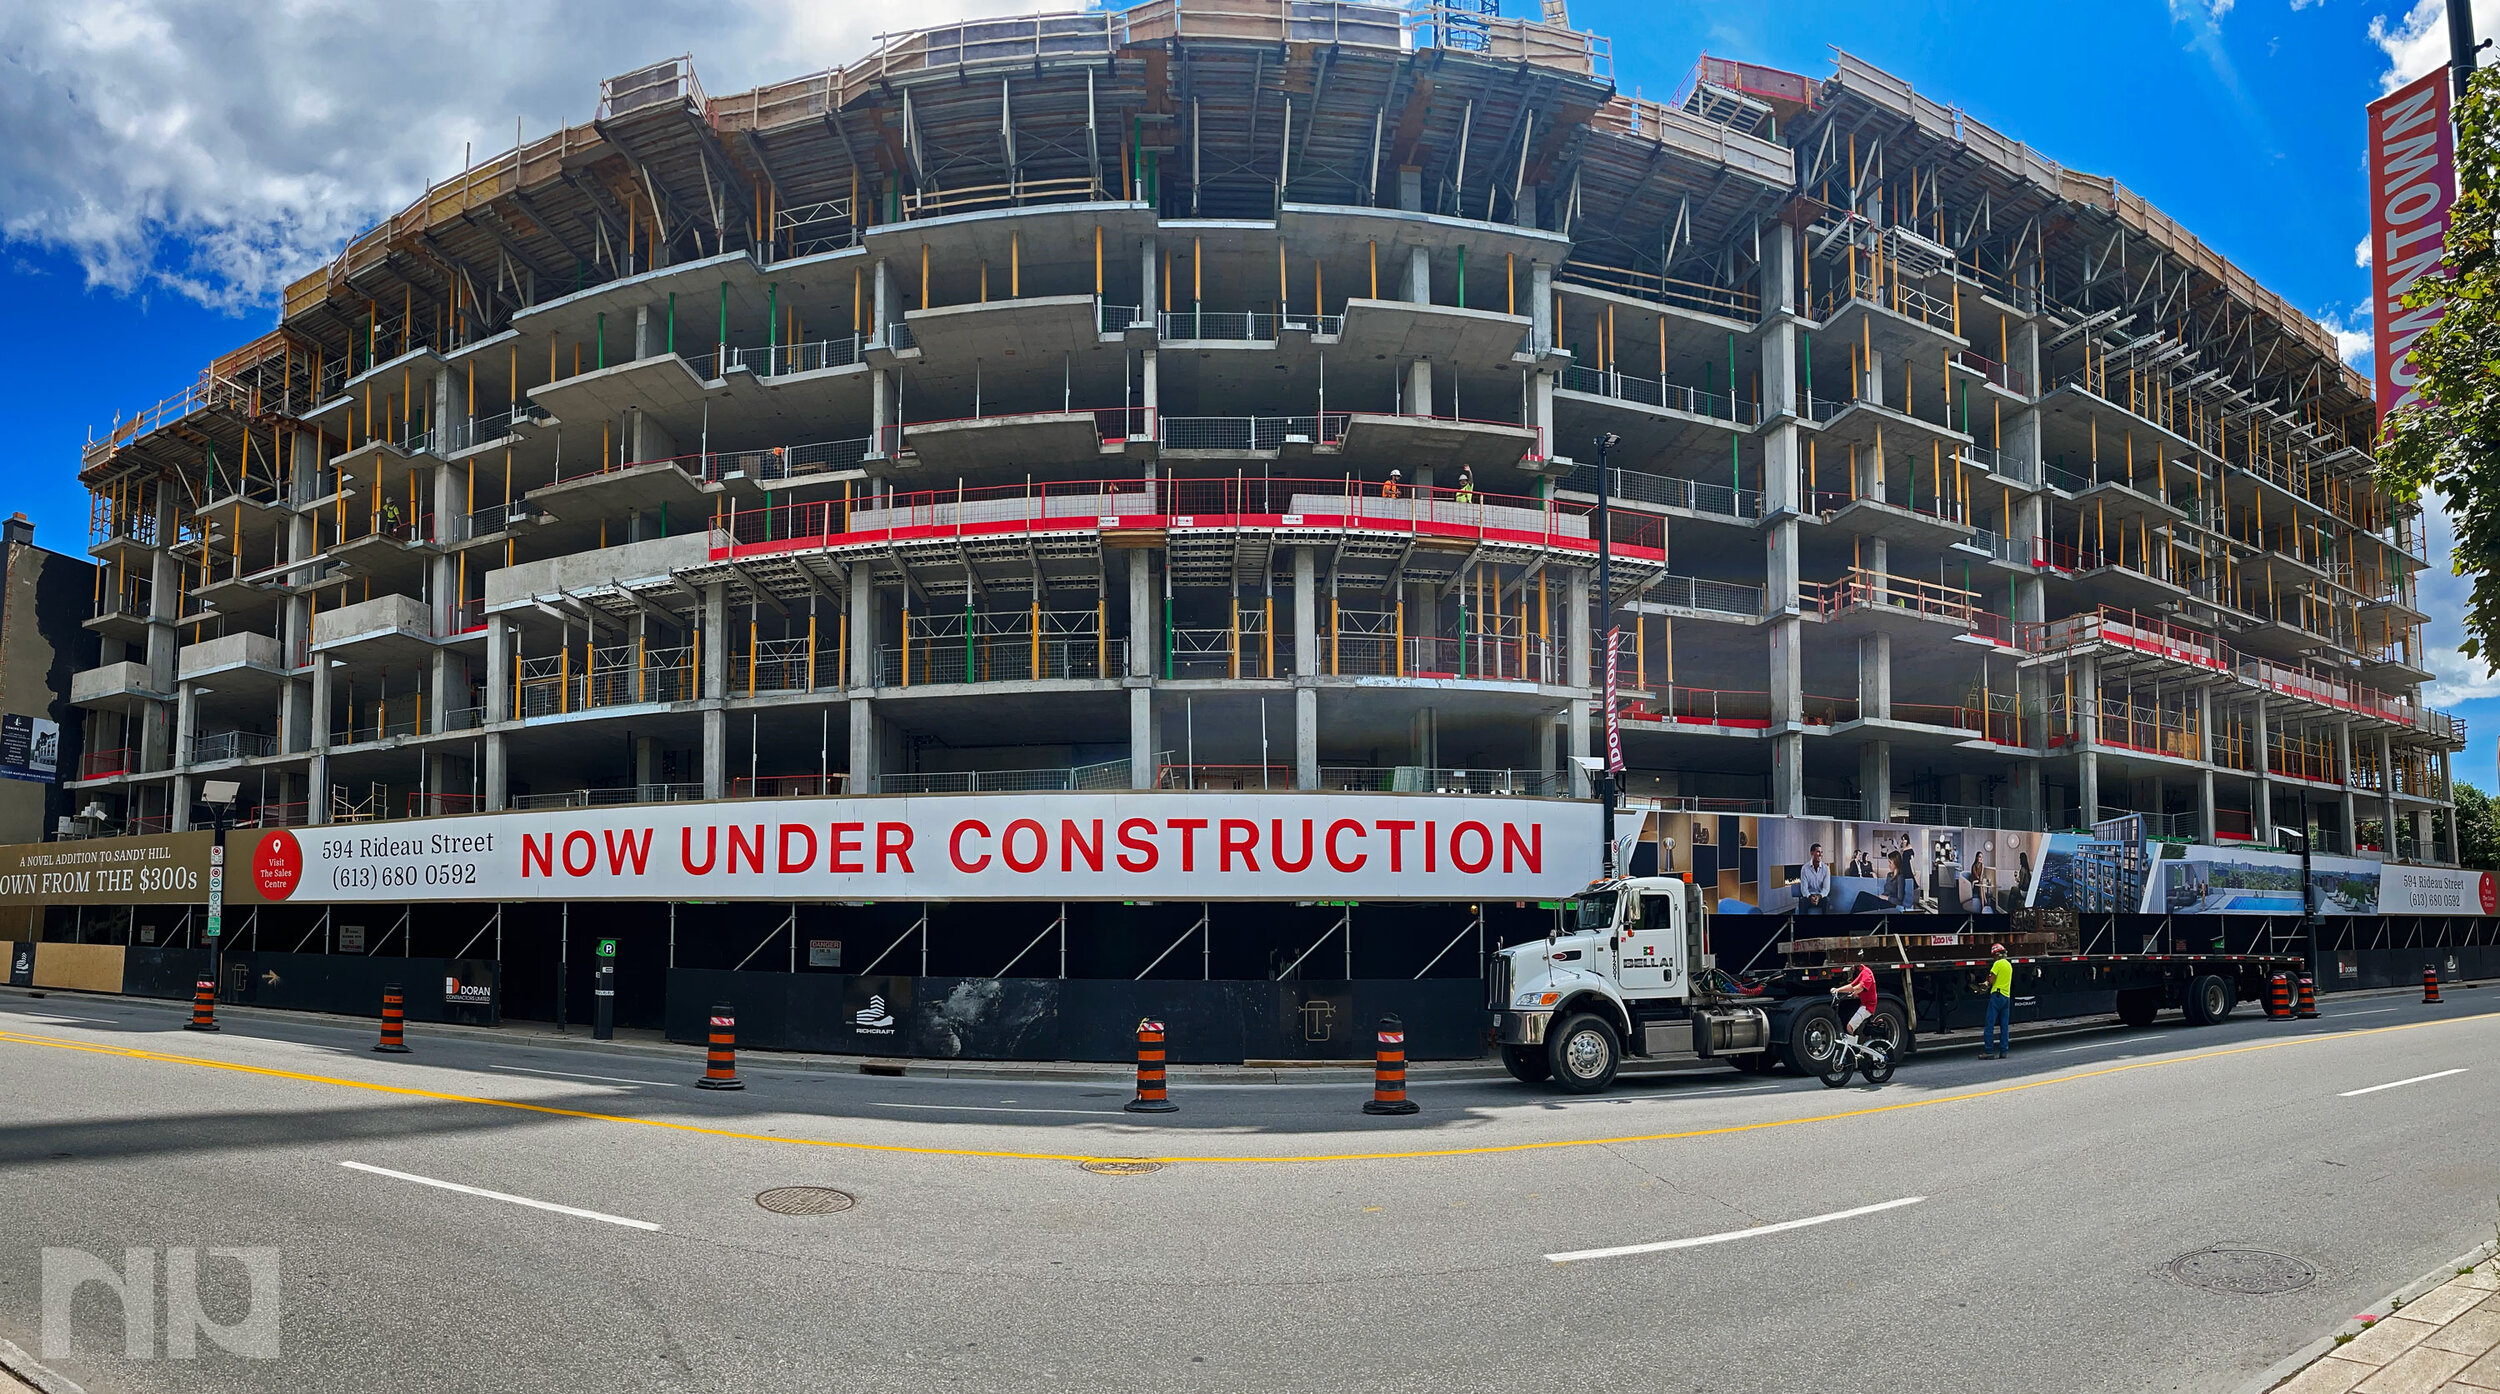
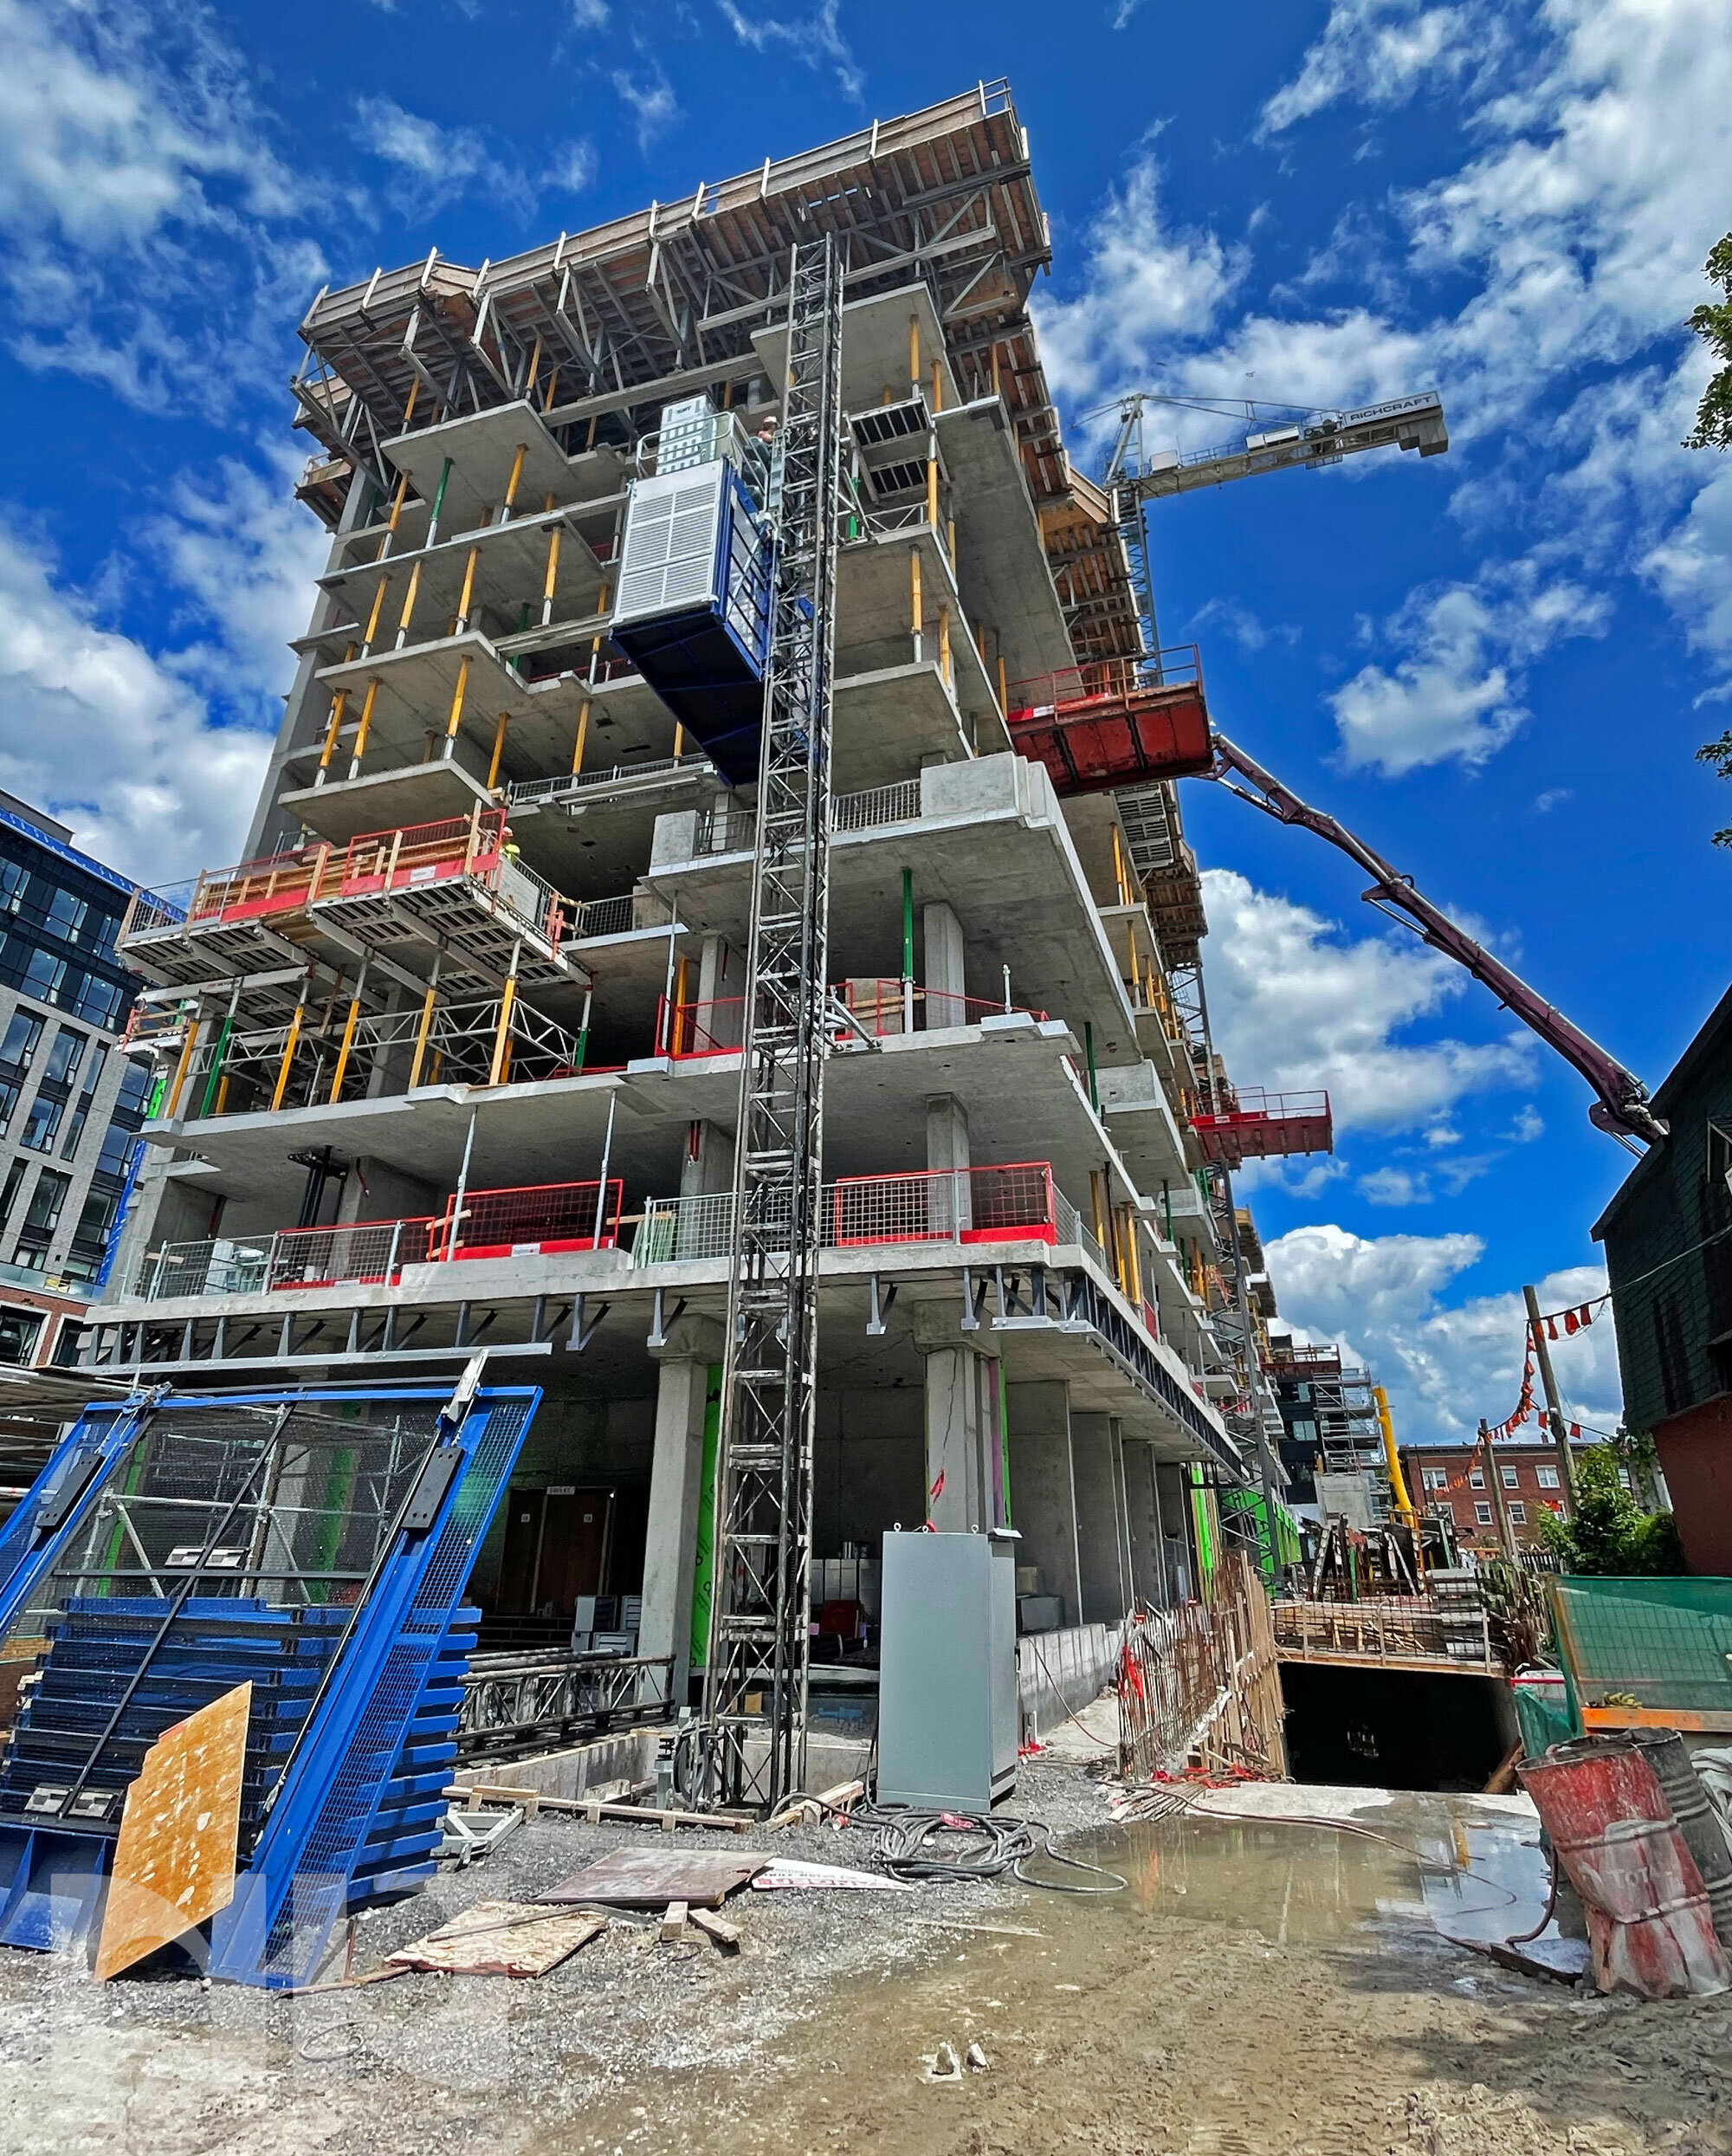
Richcraft Homes has been working hard and construction is coming along for The Charlotte. Located at 560 Rideau Street, the construction is currently pouring the 8th floor of the 14 floors and is on track for a late April or early May 2022 occupancy.

The building is roughly 40% sold out of the 197 units with pricing starting at $379,000 for the SB floorplan which is 389sqft on the 9th floor. Pricing for studio units is averaging about $1,000sqft and $800sqft for one bedroom units.

For more information about The Charlotte condos, or other pre-construction condos in Ottawa, please fill out the form at the bottom of the page.

The-Charlotte-Construction-Update-July-2021.jpg

Claridge Royale - Sales and Construction Update

Claridge Royale - Construction-Shot.jpg

**For more information about Claridge Royale, visit our Claridge Royale page here. Includes everything about Claridge Royale in one place, floorplans, renderings, etc.**

Claridge Homes continues to dominate the (pre-construction) condo market in Ottawa, and Claridge Royale is one of their projects currently under construction. Located at 180 George Street in the Byward Market, construction is well underway now and “at grade” or at street level. The building will consist of 237 units that are spread over 26 floors. The building is still on track to take occupancy on September 2023.

As of today, Claridge Royale is 66% sold out. Pricing for remaining units start at $346,000 for a “modified” Jewel floorplan - 490sqft studio unit on the 2nd floor. The most expensive unit remaining for purchase is the Paramount floorplan - 980sqft two bedroom two bathroom unit on the top floor (26 or PH2), priced at $978,000. The building average price per sqft for all units combined is $776sqft, with the lowest unit priced at $678sqft (Plush floorplan 645sqft on the 3rd floor).

For more information about Claridge Royale, or pre-construction condos in Ottawa, fill out the form below.

St Charles Market - Sales Update

**For more information about St Charles Market, visit our St Charles Market condo page here. Includes everything about St Charles Market in one place, floorplans, renderings, etc.**

Modbox Developments has come a long way with its stunning Beechwood project, St Charles Market. They are down to their last remaining unit (out of the 38 units and four penthouses) a gorgeous penthouse that is listed at $4,550,000. Penthouse #3 is a four-bedroom three-bathroom, custom-designed with 270-degree views, 3,923sqft of indoor space, and 426sqft of outdoor space. The unit includes two parking spaces and a storage locker.

https://stcharlesmarket.ca/

https://stcharlesmarket.ca/

For more information visit the St Charles Market condo page here, or fill out the form at the bottom of the page. Questions about pre-construction condos in Ottawa? Let’s chat.

Ottawa Condo Market Statistics - June 2021

Blog Image Template.jpg

Every month we take a closer look and drill down the sales data of Ottawa condos from the previous month. Here are the statistics for June ‘21 in the top five "downtown" areas - Centretown, Byward Market and Sandyhill, Little Italy (which includes Lebreton Flats), Hintonburg, and Westboro. The information will be specific to apartment-style condominiums, and only what sold through the MLS. Also important to note that DOM (Day's On Market) is calculated to include the conditional period, which in Ottawa is almost every single transaction to be roughly 14 days.


If you are currently a buyer or seller in the Ottawa condo market (not intending to solicit if currently signed), I am willing to bet that you are pretty frustrated. Some units are selling for $100-200,000 over the asking price while others are sitting - 30+ days on market with no offers. It can certainly be difficult to navigate this market, especially without any guidance.

For Buyers: Hands down, understanding the market value of properties will give you a massive upper hand. The first tip we often give is to view more properties. The more properties that you see firsthand, the better understanding of where the market is and the value of comparable properties. Over time, you are able to walk in and tell where a unit should be priced. And while it can still be difficult in this market to predict sold price, having a solid market foundation is the best place to start. Working with an agent who has this market knowledge will give you a massive advantage, especially when they sell regularly in the building and area.

For Sellers: Working with an agent that understands the pulse of the market and can help you navigate your options along with ways to meet your goals. Not every seller’s goals are the same, not every building is the same, and then add in a multitude of other variables (unit finishes, occupants, views, neighbouring buildings, etc) and you have a ton of different options to navigate selling. Pricing below market and holding offers to a set time and date - is not everyone’s cup of tea. The best thing to do is have a discussion with an expert, someone who knows your building and knows the market.

Want to chat about your options? Fill out the form at the bottom of the page, or txt/call me directly 613-286-9501.

2021 Centretown - Stats (3).jpg
2021 Byward Market & Sandy Hill - .jpg

Do you have any questions about how this information affects your investment or looking for more information to make the best decision about your purchase? Let’s chat! Fill out the form on the bottom of the page.

Kensington Lofts Hintonburg - Sneak Peek

Kensington-Lofts-Header.jpg

**For more information about Kensington Lofts Hintonburg visit our Kensington Lofts Hintonburg page which Includes everything about Kensington Lofts in one place, floorplans, renderings, pricing, etc.**

We are getting close to launch, and Orange Design Build is doing an amazing job finishing up some of these units at Kensington Lofts Hintonburg. Take a look at some of the sneak peek photos to give you an idea of what is coming.

Kensington Lofts Hintonburg will consist of 26 premium lofts - a mix of one-bedroom, two-bedroom, and private entrance loft units. Units will feature 10’ ceilings and interior design from KODA Interiors. The most significant thing to note is that these units are already under construction and will be ready for immediate occupancy! Unlike traditional projects, this brand new building will be available for moving-in in 2021! Pricing will start from the mid-$300k’s and launch to the public in summer 2021.

Register now to be first in line. Fill out the form below.