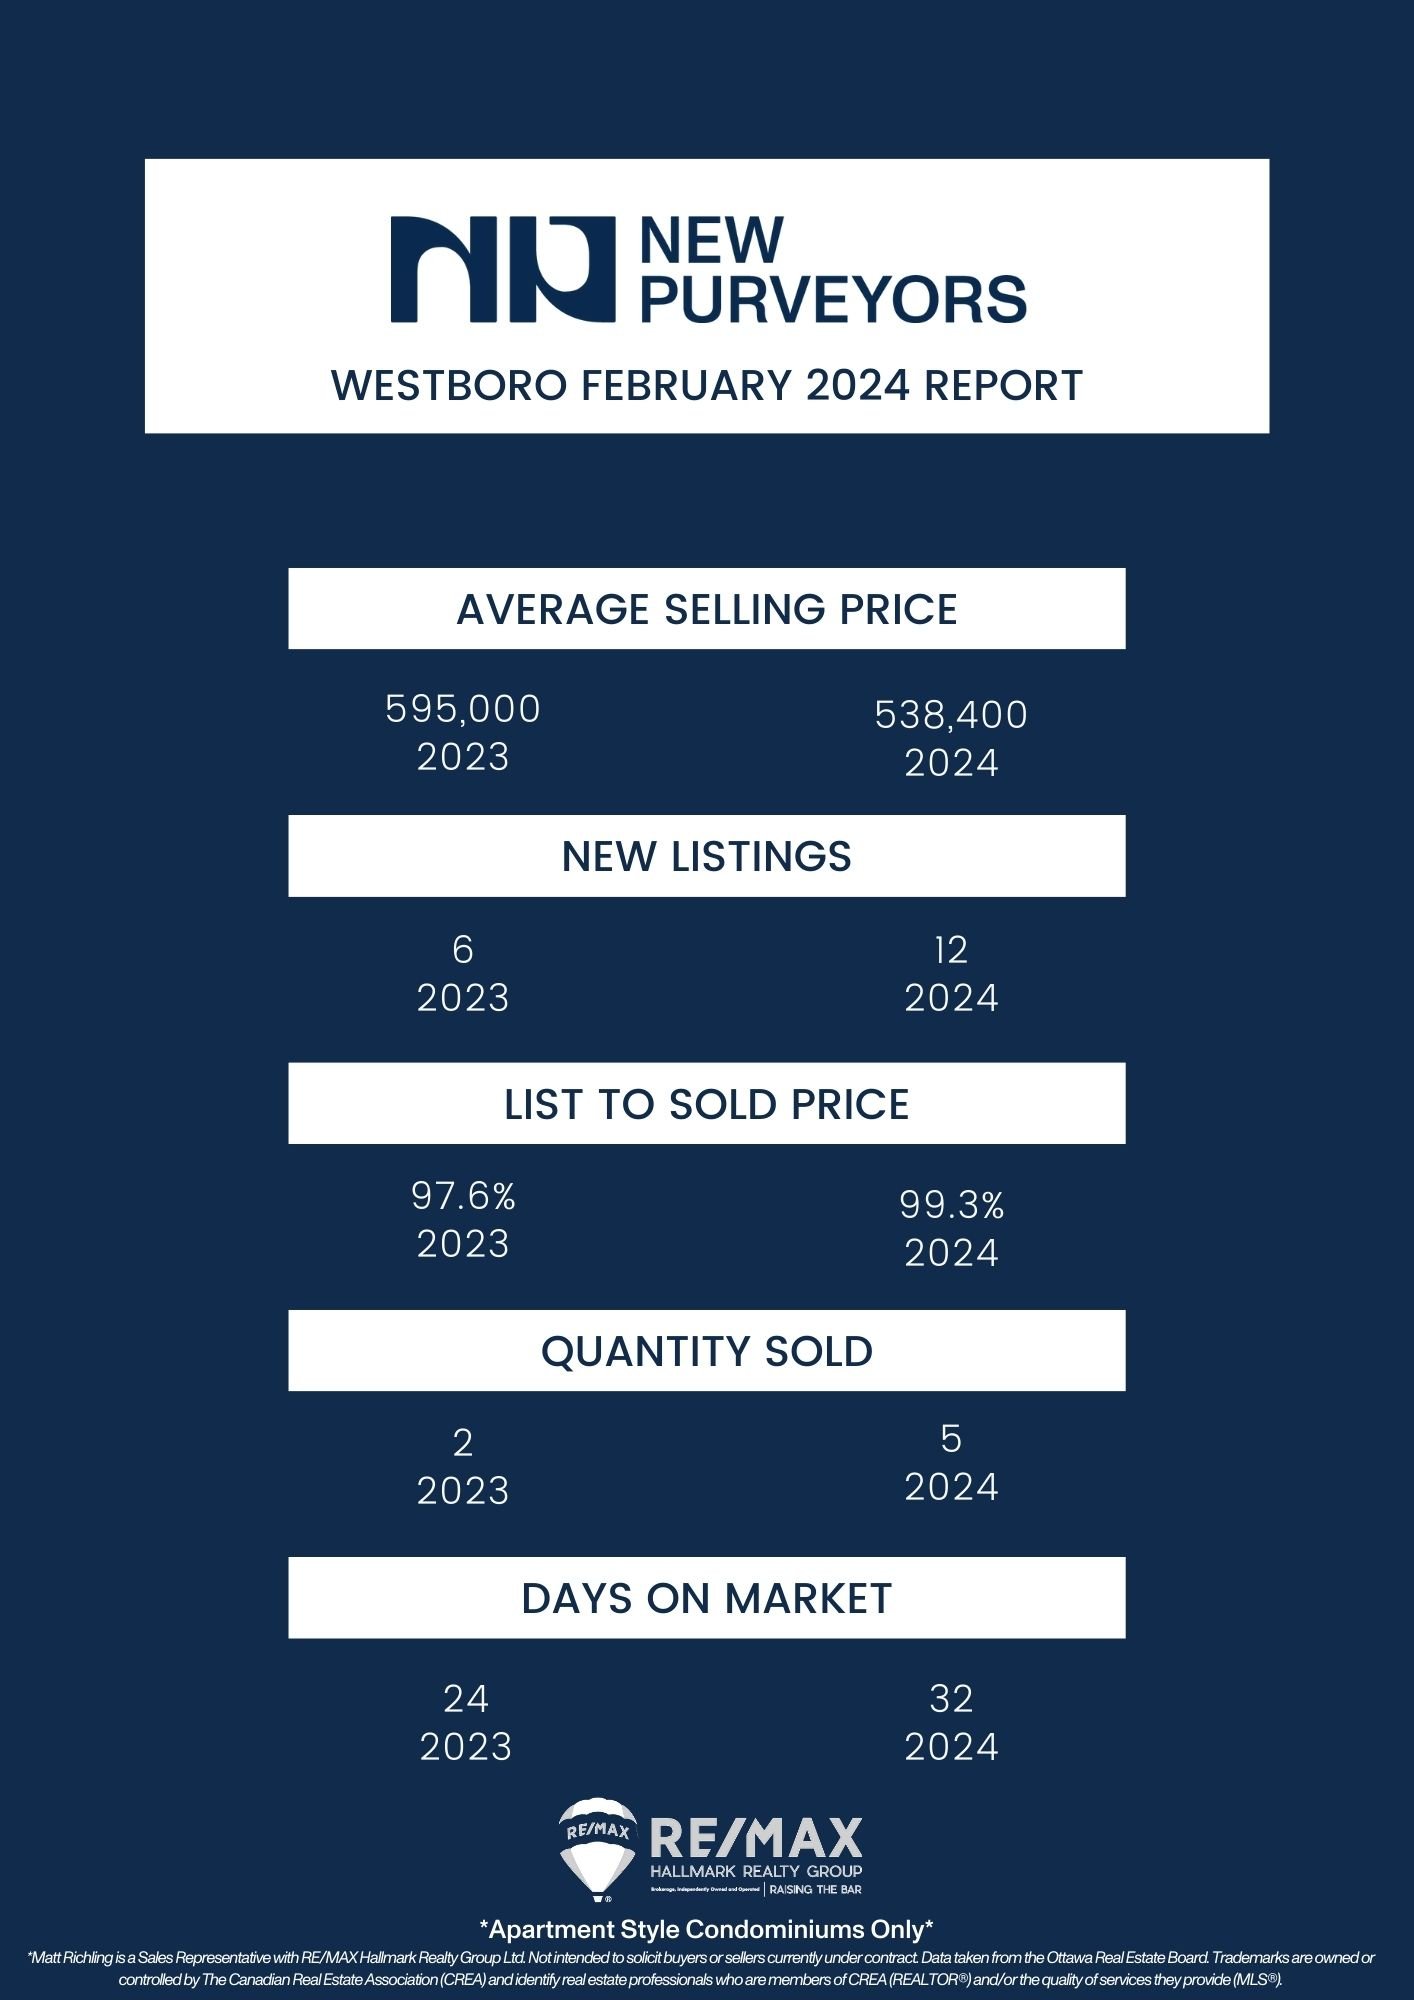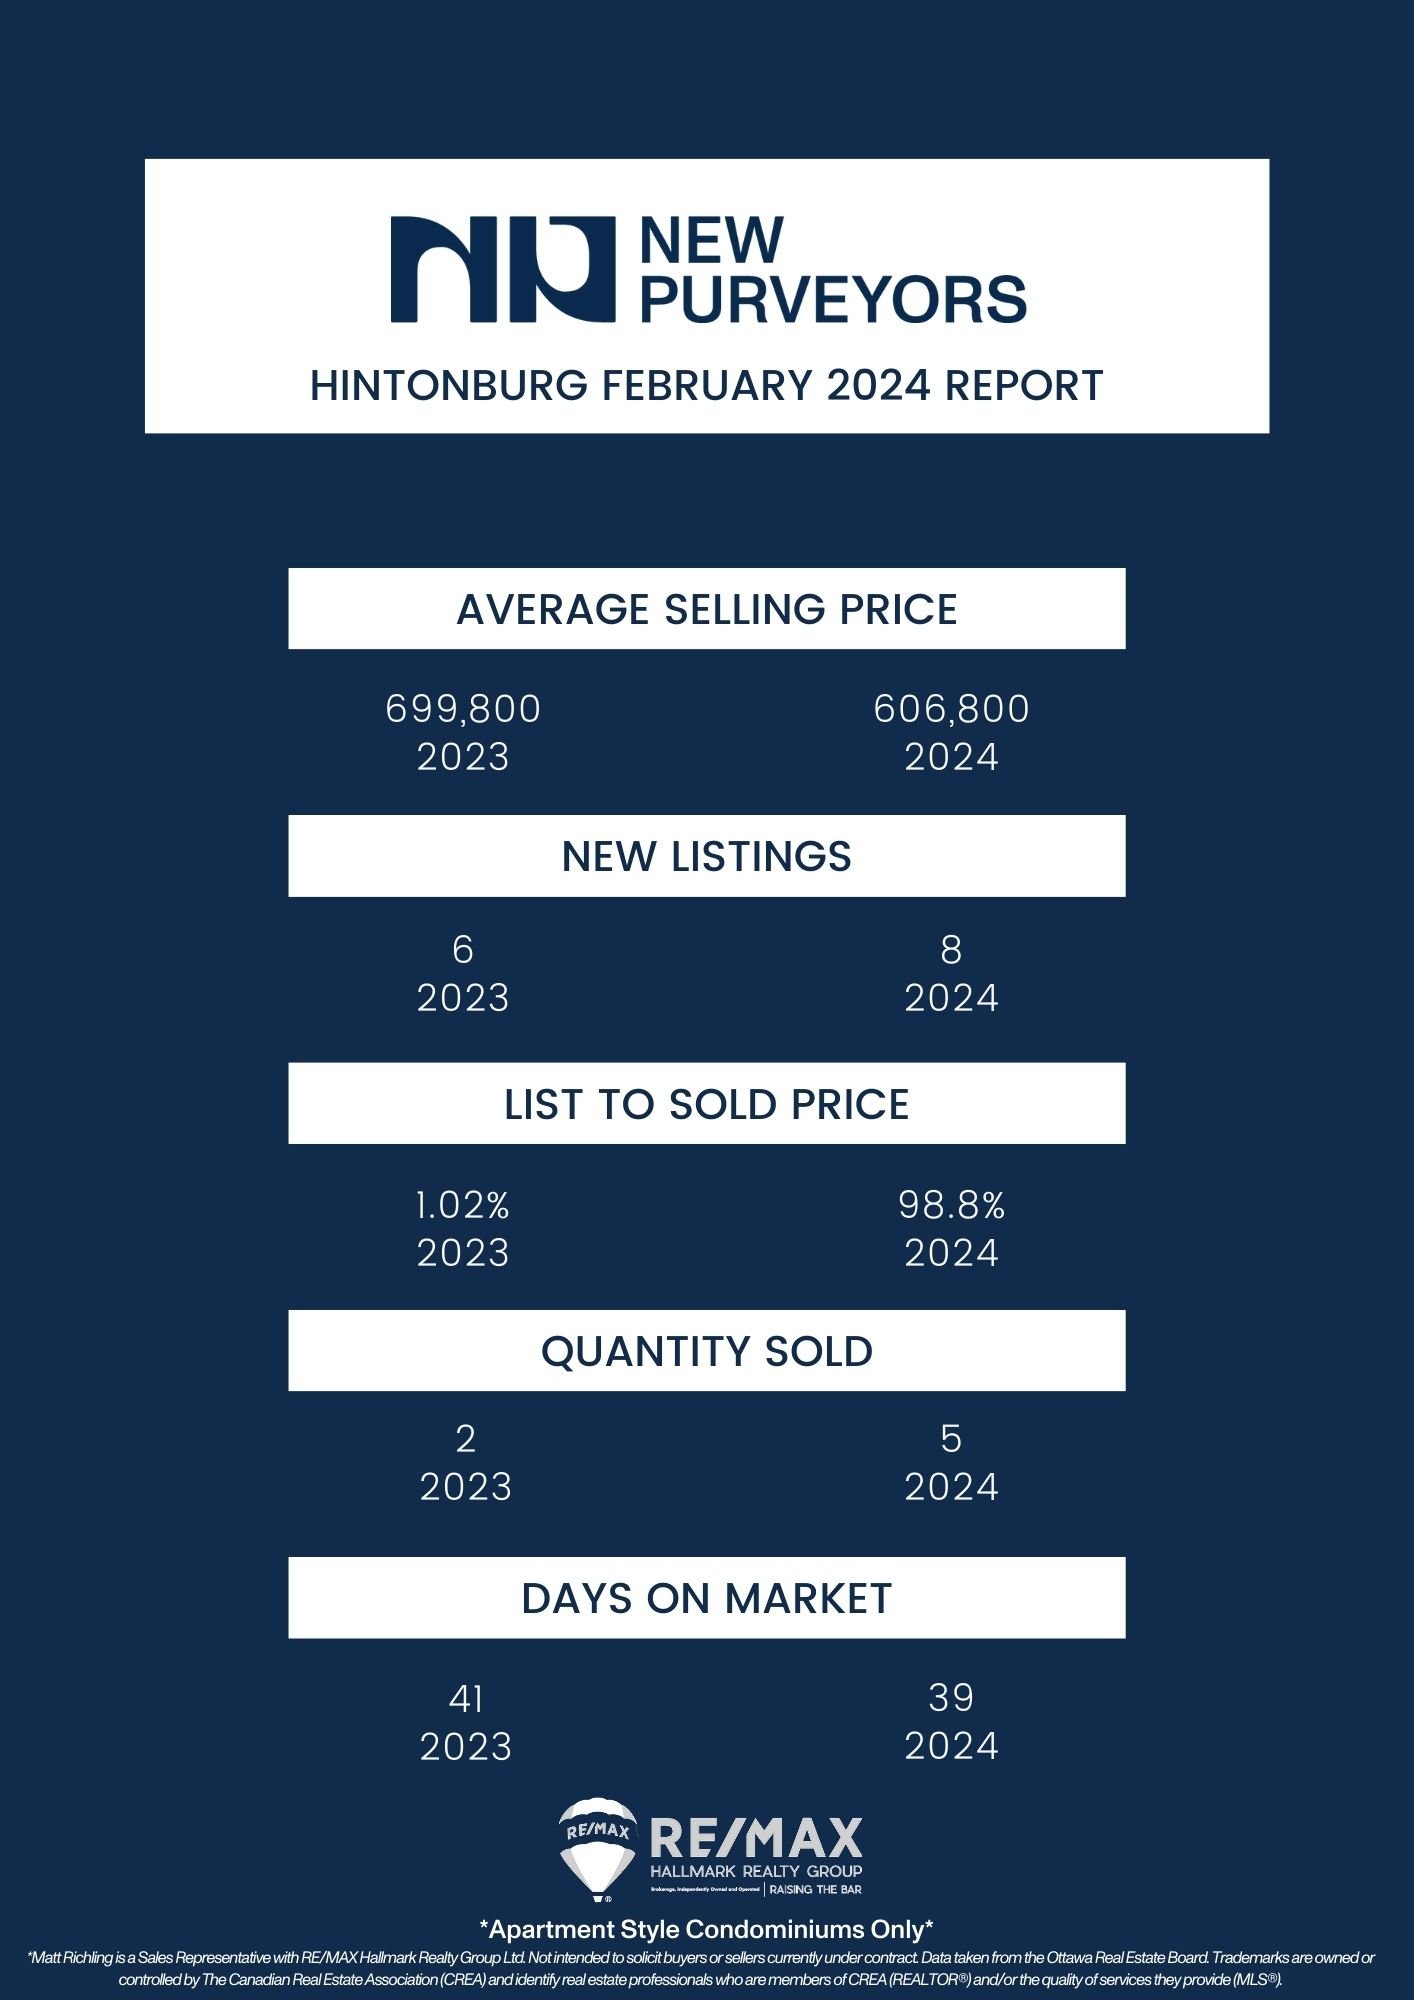
Every month we take a closer look and drill down the sales data of Ottawa condos from the previous month. Here are the statistics for February 2024 in the top five "downtown" areas - Centretown, Byward Market and Sandy Hill, Little Italy (which includes Lebreton Flats), Hintonburg, and Westboro. The information will be specific to apartment-style condominiums, and only what is sold through the MLS. Also important to note that DOM (Day's On Market) is calculated to include the conditional period, which in Ottawa is roughly 14 days for almost every single transaction.
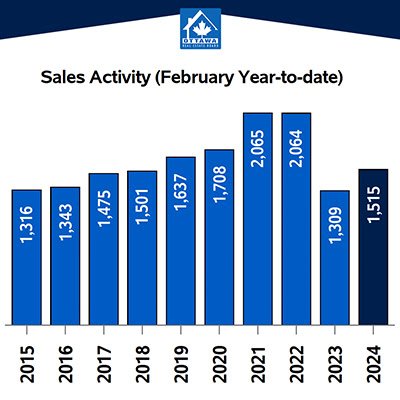
In February 2024, a total of 886 homes were sold through the MLS® System of the Ottawa Real Estate Board, marking a notable increase of 15.2% compared to the same period last year.
Despite this rise, home sales fell short of the five-year average by 13.8% and the 10-year average by 5.7% for the month of February. OREB President Curtis Fillier noted that while Ottawa's real estate market remains robust with rising metrics, affordability continues to be a concern, leaving many potential buyers and sellers sidelined.
MPAC recently highlighted a significant decrease in communities offering homes under $500,000, dropping from 74% a decade ago to just 19% today across Ontario.
Fillier emphasized the persistent demand for housing in Ottawa, attributing market activity constraints to a shortage of affordable and suitable housing options. OREB is advocating for impactful measures such as permitting four residential units on property lots and eliminating exclusionary zoning to address this issue.
Regarding prices, the MLS® Home Price Index (HPI) revealed that the overall benchmark price in February 2024 was $628,500, marking a 2.8% increase from the previous year. Single-family homes saw a benchmark price increase of 3.1% to $708,500, while townhouses/row units and apartments experienced more modest gains.
The average price of homes sold in February 2024 reached $651,340, up 2% from February 2023, with the total dollar volume of sales amounting to $577 million, a significant rise of 17.5% year-over-year.

OREB cautioned against relying solely on average sale prices to gauge individual property value fluctuations, emphasizing the variability of prices across different neighbourhoods over time.
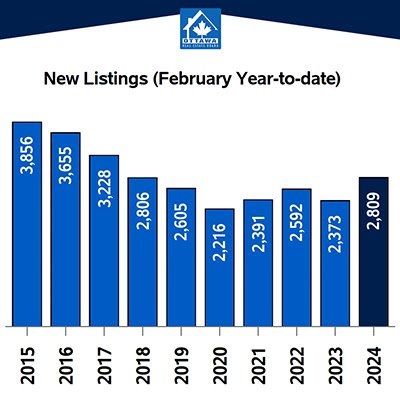
In terms of inventory and new listings, February 2024 saw a notable 29.5% increase in new residential listings compared to the previous year, totalling 1,539. Active residential listings also rose by 16.3% to 2,158 units, with the months of inventory remaining steady at 2.4, indicating the time it would take to sell current inventories at the current rate of sales activity remained unchanged from February 2023.
Important to note is that these statistics can only be as accurate as there are condos sold in Ottawa. The more condos sold in an area, the more accurate the averages will be.
Want to chat about your options? Fill out the form at the bottom of the page, or text/call us directly at 613-900-5700 or fill out the form at the bottom of the page.
Do you have any questions about how this information affects your investment or looking for more information to make the best decision about your purchase? Let’s chat! Fill out the form on the bottom of the page.